



.svg)
 Shop floor execution
 Maintenance
 Production
 Skills
.png?width=60&height=60&name=chart-line-up%20(1).png) Manufacturing Intelligence
Manufacturing Intelligence
 Automotive
 Building materials
 Packaging
 CMMS/EAM
 MES
MES
 Connected Worker
 Manufacturing Intelligence
 Case studies
 Blog
Blog
 Ebooks & Guides
 Webinars
 Events
.svg) OEE Calculator
OEE Calculator
 Downtime Cost Calculator
 About Us
 Partners
 Newsroom
 Support
 Careers
 Trust center


.svg)


When a critical production line stops unexpectedly, the immediate instinct on the shop floor is to get it running as fast as possible. A technician resets a tripped drive, clears a jammed conveyor, or adjusts a sensor, and production resumes. But when the same breakdown returns two shifts later, it becomes clear that a "quick fix" isn't the same as fixing the problem.
Relying on temporary fixes creates a reactive firefighting culture that drains plant capacity, inflates maintenance costs, and degrades Overall Equipment Effectiveness (OEE). To stop recurring breakdowns, manufacturers must shift from symptom-level patches to systematic problem-solving.
This guide covers the core principles of root cause analysis in manufacturing, the most effective RCA methodologies, a six-step implementation framework, a real-world case study, and how modern platforms automate the RCA process.
What is root cause analysis? (and why "fixing fast" isn't enough)
Root cause analysis (RCA) is a structured problem-solving methodology designed to identify the fundamental systemic vulnerability behind an operational failure rather than merely treating its surface symptom.
Consider a packaging line motor that repeatedly overheats and trips. A technician who focuses only on "fixing fast" might reset the thermal relay or install an external cooling fan. The line runs for another four hours, but the motor trips again on the next shift. The surface symptom (overheating) was addressed, but the root cause—a misaligned drive belt creating excessive mechanical resistance—remains unfixed.
Resetting equipment without investigating the underlying cause ensures the failure will repeat. While proactive tools like failure mode and effects analysis (FMEA) help evaluate risk before installation, structured RCA is required to eliminate recurring failures once equipment is operational.
Why root cause analysis matters more in manufacturing
In a high-speed production environment, an unaddressed root cause compounds rapidly. A minor mechanical issue that causes a two-minute micro-stop every hour adds up to 16 minutes of lost production per day, over 90 hours of lost capacity per year on a single line, plus accelerated wear on adjacent components.
Despite its importance, manual RCA frequently stalls in manufacturing facilities due to three common obstacles:
- Scattered data: Operational information is isolated across paper logbooks, whiteboards, spreadsheets, and disconnected software modules. Industry data indicates that workers spend up to 50% of their week simply chasing down information.
- Time lag: RCA investigations often occur days or weeks after an incident during a monthly review meeting. By that time, physical evidence is gone, and memory of the event has faded.
- Subjective guesswork: Without objective machine data, team discussions devolve into opinions and debate rather than data-verified analysis.

The core root cause analysis methods
Manufacturing teams use several established RCA frameworks. Selecting the right method depends on the complexity of the failure and the availability of data.
The 5 Whys
- When to use it: Best for straightforward, single-cause operational disruptions or line stops.
- How it works: An iterative questioning technique that explores the cause-and-effect relationships underlying a problem. By asking "Why?" five consecutive times, teams move past surface symptoms to locate the systemic failure.
Fishbone (Ishikawa) diagram
- When to use it: Best for complex, multi-factor operational or quality problems.
- How it works: A visual brainstorming framework that categorizes candidate causes across six primary operational domains: Man, Machine, Method, Material, Measurement, and Environment (the 6 Ms).
Pareto analysis
- When to use it: Best for prioritizing where to focus problem-solving resources across a facility.
- How it works: Applying the 80/20 rule to shop-floor loss data, Pareto charts help identify the 20% of failure categories responsible for 80% of total plant downtime.
FMEA (failure mode and effects analysis)
- When to use it: Best for proactively analyzing new equipment, line re-tooling, or process redesigns.
- How it works: A structured risk-assessment methodology that scores potential failure modes by severity, occurrence rate, and detectability before failures happen on the floor.
Learn how to execute an FMEA on the shop floor.
8D and fault tree analysis
- When to use it: Best for high-stakes, safety-critical, or customer-impacting quality failures.
- How it works: Eight Disciplines (8D) is a structured, team-based problem-solving standard common in automotive and aerospace supply chains. Fault Tree Analysis (FTA) uses Boolean logic to map complex, intersecting failure paths.
Root cause analysis step-by-step
To ensure investigations deliver permanent solutions rather than temporary fixes, teams should follow a standardized 6-step process.
1. Define the problem precisely
Quantify the exact variance between expected performance and actual output. Avoid vague statements like "the machine keeps jamming." Instead, define the specific deviation: "Line 3 case packer experienced 12 micro-stops totaling 38 minutes of downtime during Shift 2 on Tuesday."
2. Collect the data
Gather objective data from the event, including PLC state logs, sensor trends, operator notes, maintenance histories, and raw material batch numbers. Relying on verbal memory days after the event leads RCA efforts astray.
3. Map the possible causes
Use a Fishbone diagram or structured team brainstorming to lay out all potential contributing factors across machinery, methods, materials, and human execution before narrowing the focus.
4. Find the root cause
Apply the 5 Whys methodology to drill down through candidate causes. Continue questioning until reaching a root cause that can be verified with objective floor data rather than subjective opinion.
5. Implement corrective action
Design an action plan that directly addresses the root cause. Assign the task to a specific, qualified owner with a clear completion deadline and required verification steps.
6. Verify and standardize
Monitor production metrics over subsequent weeks to confirm the failure does not recur. Once verified, update Standard Operating Procedures (SOPs), preventive maintenance (PM) checklists, and training guides to ensure the solution is consistent across all shifts and sites.
Practical example: Chronic downtime on a packaging line
The problem
A high-speed bottling facility experienced recurring 2-to-3 minute micro-stops on its primary casing unit, accumulating 45 minutes of lost production per shift.
Data collection
Real-time operational tracking revealed that 82% of these micro-stops occurred within two hours following a product SKU changeover.
5 Whys investigation
- Why did the casing unit stop? The bottle pusher arm jammed against the entry guide rail.
- Why did the pusher arm jam? The guide rail was out of alignment by 4 millimeters.
- Why was the guide rail out of alignment? The mounting adjustment bracket slipped during high-speed operation.
- Why did the bracket slip? The mounting threads were worn, preventing proper clamping torque during changeover setups.
- Why were the worn threads not identified earlier? The calendar-based PM inspection only checked bracket position, not mechanical thread wear.
Corrective action & verification
Maintenance replaced the bracket assembly and updated the changeover SOP to include a calibrated torque-wrench specification. A condition-based PM task was added to inspect thread wear every 1,000 changeover cycles. Post-implementation tracking confirmed zero guide-rail jams over the following 90 days.
From manual RCA to automated, connected RCA
Manual RCA is slow, reactive, and vulnerable to incomplete documentation. When operational logs sit on paper clipboards or isolated spreadsheets, chronic micro-stops go unanalyzed until they escalate into a major equipment failure.
Automated, connected RCA transforms problem-solving by embedding real-time intelligence directly into daily plant workflows:
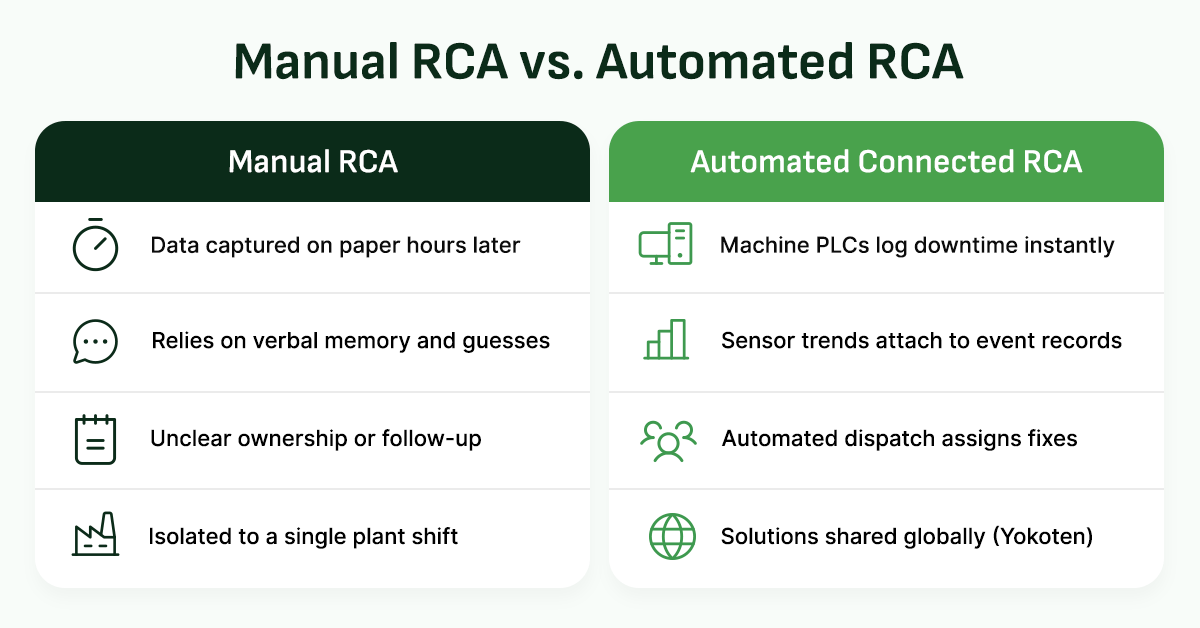
Modern manufacturing operations platforms automate the RCA lifecycle:
- Instant abnormality detection: The moment a machine deviates from its normal cycle times or stops, the system logs the event and automatically captures sensor data.
- Pattern recognition: Machine learning algorithms aggregate micro-stops across shifts, surfacing hidden failure patterns that human teams miss.
- Prescriptive action: Execution tools analyze historical dispatch records to recommend the most effective repair procedure to the responding technician.
- Automated escalation: Corrective actions are assigned directly to maintenance schedules with required verification sign-offs.
Learn how you can automate root cause workflows across your facilities using connected operations technologies.
Root cause analysis tools and software
When evaluating software to support root cause analysis, operations and IT leaders should select platforms that drive live action on the shop floor rather than static reporting tools.
Key capabilities to evaluate include:
- Real-time data capture: Direct connection to PLCs, IoT sensors, and operator interfaces to capture downtime events as they occur.
- Embedded RCA frameworks: Built-in 5 Whys, Fishbone, and Pareto templates linked directly to work orders and dispatch tickets.
- Automated pattern detection: Intelligent analysis that highlights recurring micro-stops and chronic equipment issues across production lines.
- Closed-loop workflow tracking: Automated routing that assigns corrective actions to qualified personnel, tracks completion, and requires data verification.
- Multi-site knowledge sharing (Yokoten): Centralized repositories that allow root-cause fixes established at one facility to be deployed across all global plants.
A connected manufacturing operations platform like L2L integrates these capabilities natively, embedding root cause analysis directly into daily maintenance, quality, and production workflows.
Frequently asked questions about root cause analysis
What are the 5 steps of root cause analysis?
The five core steps of RCA are: (1) Define the problem precisely, (2) Collect objective data, (3) Identify candidate causes, (4) Determine the true root cause, and (5) Implement and verify corrective actions. Many manufacturing teams add a sixth step: standardizing the solution into SOPs across all shifts.
What's the difference between 5 Whys and a fishbone diagram?
The 5 Whys is a linear problem-solving tool that drills down to a single root cause through iterative questioning. A Fishbone diagram is a visual mapping tool that categorizes multiple candidate causes across six operational categories (Man, Machine, Method, Material, Measurement, Environment) before narrowing down the focus.
What are the 5 P's of root cause analysis?
The 5 P's is an investigation framework used to scope a failure: Problem (what occurred), Place (where it happened), Procedure (what process was active), People (who was involved), and Prevention (what safeguards prevent recurrence).
Can root cause analysis be automated?
Key aspects of RCA can be automated: software automatically captures downtime data, identifies recurring failure patterns, and recommends corrective actions based on historical event logs. However, human expertise remains necessary to validate root causes, execute physical repairs, and update operational standards.
What is the best root cause analysis method for manufacturing?
There is no single best method. Effective teams match the tool to the problem complexity. Use the 5 Whys for straightforward equipment stops, Fishbone diagrams for complex multi-factor quality issues, Pareto analysis to prioritize shop-floor losses, and FMEA to evaluate risks proactively.
Ready to eliminate recurring downtime on your shop floor?
Connected operations platforms turn real-time equipment signals into guided, automated root-cause solutions.
See how L2L automates problem-solving for global manufacturers.