WEBINAR | JUNE 25 at 11 AM ET
Kill the Reporting Lag: How Mueller Industries Went Digital
Talk to an Expert
Talk to an Expert

No results found

Try a different search term or browse by category below.

OEE Calculator

OEE Calculator

Discover the true efficiency of your manufacturing operations. Enter your shift data below to analyze your Overall Equipment Effectiveness (OEE) and pinpoint exactly where productivity is lost.

Production Data

Configure your production metrics to analyze your OEE score.

Time Metrics

Shift Length (Hours) Total scheduled duration of the shift.
line
Planned Breaks (Minutes) Scheduled time off (lunches, meetings).
line
Unplanned Downtime (Minutes) Time lost to breakdowns or material shortages.
line

Production Metrics

Ideal Cycle Time (Seconds) The fastest possible time to produce one part.
line
Total Parts Produced Total parts manufactured, regardless of quality.
line
Defective Parts (Count) Scrapped or rejected parts.
line

Your OEE Analysis

Overall Equipment Effectiveness Breakdown

Enter your parameters on the left to generate your custom report.

How to read your OEE score

Every 1% increase in OEE can unlock between $20K and $200K in annual savings per plant—a powerful bridge to your ROI conversation.

0 %
An OEE score indicating reactive operations.

Teams experience major losses and constant firefighting.
0 %
The average OEE score for manufacturers.

There's still substantial room for greater throughput.
0 %
An OEE score indicating strong performance.

Teams use standard work and basic preventive maintenance.
0 %
An OEE score indicating world-class performance.

Production is optimized by real-time visibility and automated dispatching.

The OEE formula explained

OEE = Availability × Performance × Quality

OEE is the product of multiplying three key metrics: Availability, Performance, and Quality.

Since these percentages compound against each other, a small drop in one area can have a big impact. E.g., 90% × 90% × 90% = 72.9% OEE

Availability

Run Time / Planned Production Time

Availability measures the actual time your equipment is running compared to the time it was scheduled to run. It exposes major stops, such as unplanned equipment breakdowns and lengthy changeovers. Because these losses are so visible, improving Availability is typically your biggest year-one win.


Performance

(Ideal Cycle Time × Total Count) / Run Time

Performance evaluates the speed of your production line against its maximum designed capacity. It captures hidden speed losses and micro-stops that are nearly impossible to track manually with paper logs.

Quality

Good Count / Total Count

Quality measures First-Pass Yield, the percentage of parts produced that meet standards the first time. Tracking this is critical because rework costs you twice: once to make the defective part, and once to fix it.

The Six Big Losses
your OEE score is hiding

OEE shows you exactly where you need to intervene.

oee calculator

Availability Losses

1. Unplanned Stops: Equipment breakdowns, incorrect materials, or material stockouts.

2. Planned Stops: Changeovers, routine cleaning, or scheduled maintenance.

oee calculator (1)

Performance Losses

3. Micro-stops: Brief jams or misalignments that last only a few minutes.

4. Slow Cycles: Equipment running below ideal speed due to excessive wear or operator inexperience.

oee calculator (2)

Quality Losses

5. Production Rejects: Scrap produced during steady-state production.

6. Startup Rejects: Scrap produced while equipment is warming up or during changeover routing.

Where manual OEE tracking fails

Paper-based tracking distorts OEE calculations due to three common mistakes:

  1. Inconsistent definitions of downtime across different shifts lead to skewed aggregate data.

  2. Micro-stops disappear because operators don't have time to log them.

  3. Changes in Ideal Cycle Times aren't updated, making the baseline inaccurate.

While this calculator is a good starting point, a live dashboard is what actually makes OEE actionable.

Real-time visibility

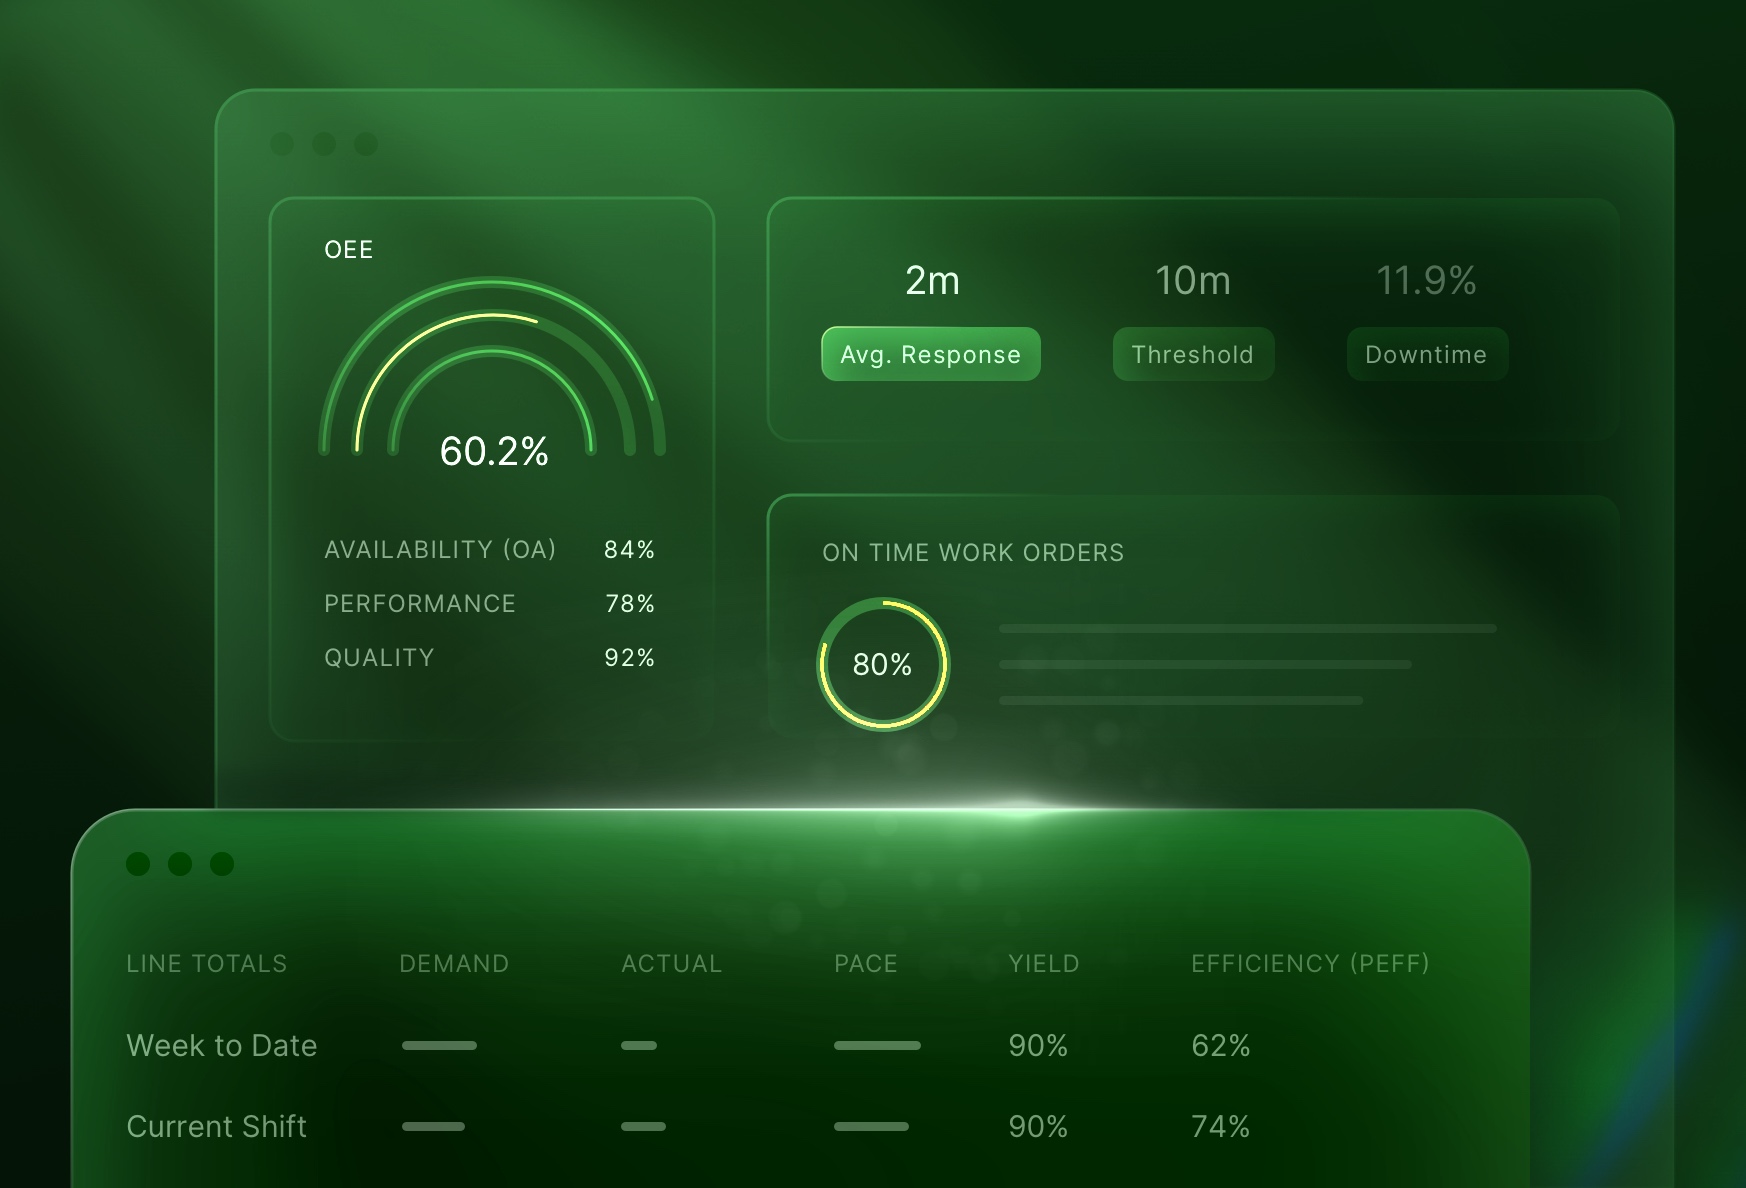
How L2L automates OEE tracking

  • Automatic data capture

  • Consistent definitions

  • Real-time dashboards

  • Six Big Losses built in
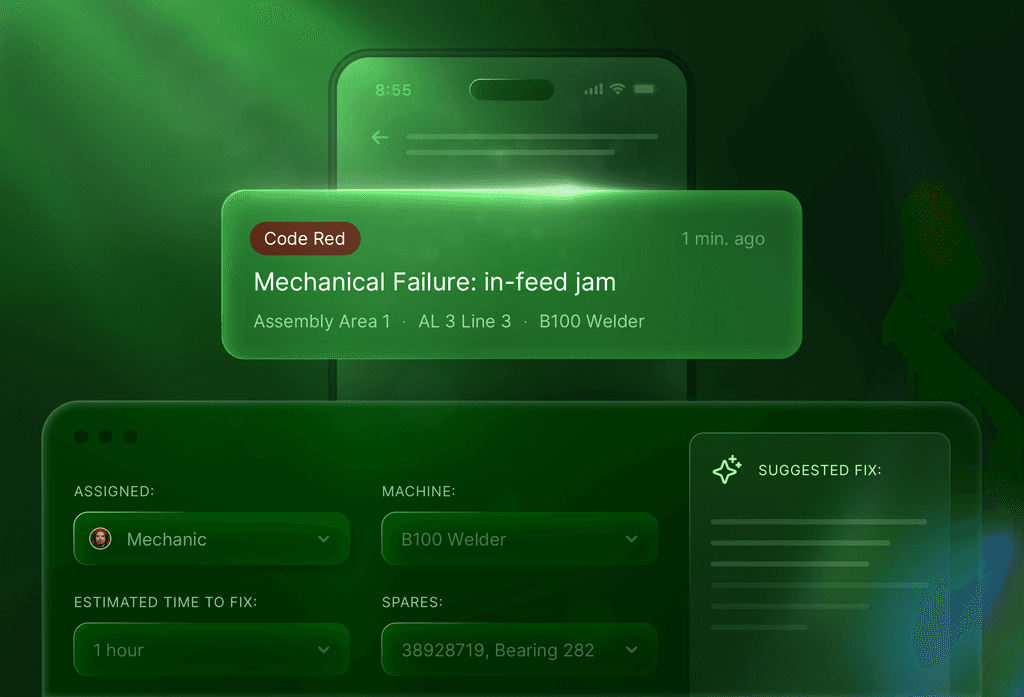
  • Connected response

L2L manufacturing software Integration BOOST PRODUCTION PERFORMANCE

Frequently asked questions

What is a good OEE score?

While 85% is widely cited as world-class, the typical factory averages around 60%. The goal should be steady improvement against your own baseline rather than chasing an arbitrary industry benchmark.

How is OEE different from TEEP?

TEEP (Total Effective Equipment Performance) measures utilization against a 24/7 calendar year (all available time). OEE only measures utilization against scheduled Planned Production Time.

Should planned downtime count against OEE?

No. OEE only factors in Planned Production Time. Routine maintenance scheduled during off-shifts does not negatively impact your OEE score.

Why is my Performance score above 100%?

A Performance score over 100% indicates that your Ideal Cycle Time baseline is inaccurate. Your machines are currently running faster than the system thinks is physically possible.

How often should we calculate OEE?

Manual calculations are usually done per shift or weekly, which is often too late to fix issues. Best-in-class manufacturers calculate OEE in real time with automated software to drive immediate action.

Does L2L's platform replace manual OEE calculation?

Yes. L2L automatically captures, calculates, and visualizes your OEE data in real time, turning raw percentages into automated maintenance and production workflows.

From measurement
to value

Measuring your OEE is only the first step. To secure funding for improvements, you must translate OEE into actual financial value.