Standardize the system, not just the metric.
One lean operating system across every site. Meetings run from a shared live board, standard work follows the same guided steps, and OEE is measured the same way everywhere, instead of every plant running its own CI playbook.
-
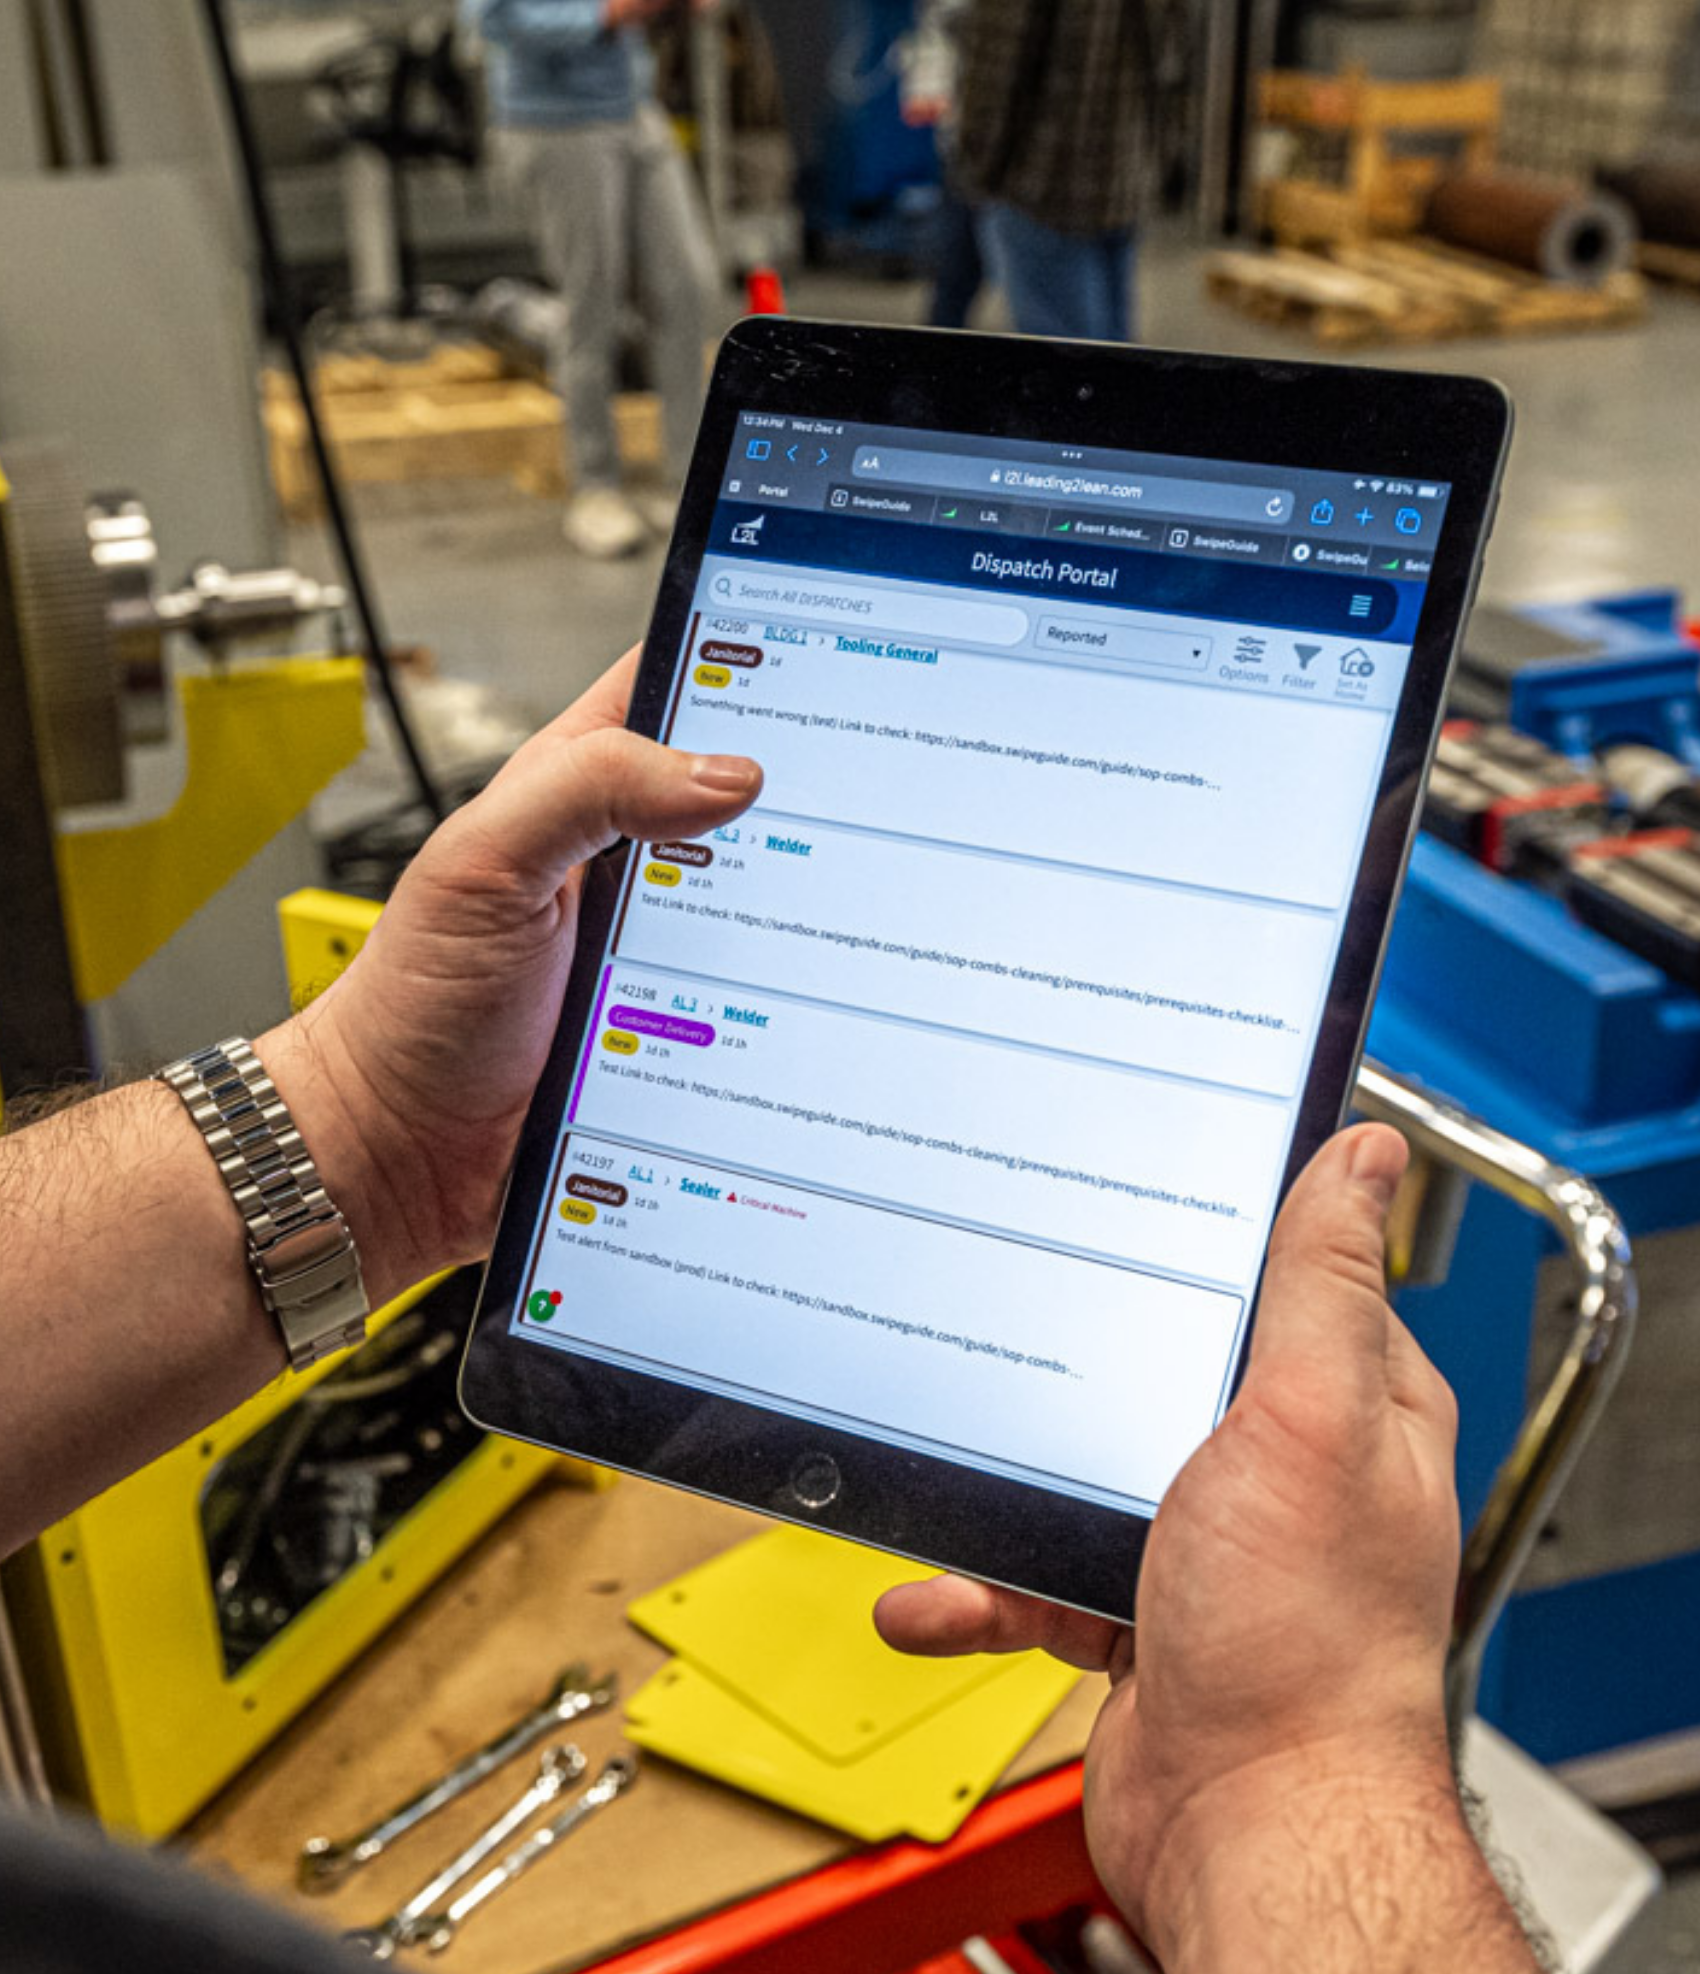
Give every level the same escalation structure.
-
Make the OEE-to-cost case without the manual work.
-
Roll out standard work with a system built for adoption.
The problems we solve for
CI and OpEx teams
No shared meeting structure or language means no plant-to-plant comparison. L2L gives every site the same definitions, checklists, and boards, so results compare and what works can be shared.
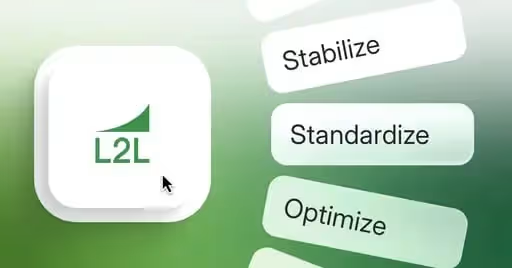
CI teams often own the rollout alongside their regular work. The L2L Method gives you a three-step path of Stabilize, Standardize, and Optimize, and standard implementation takes 14 to 60 days.
What CI teams get
-
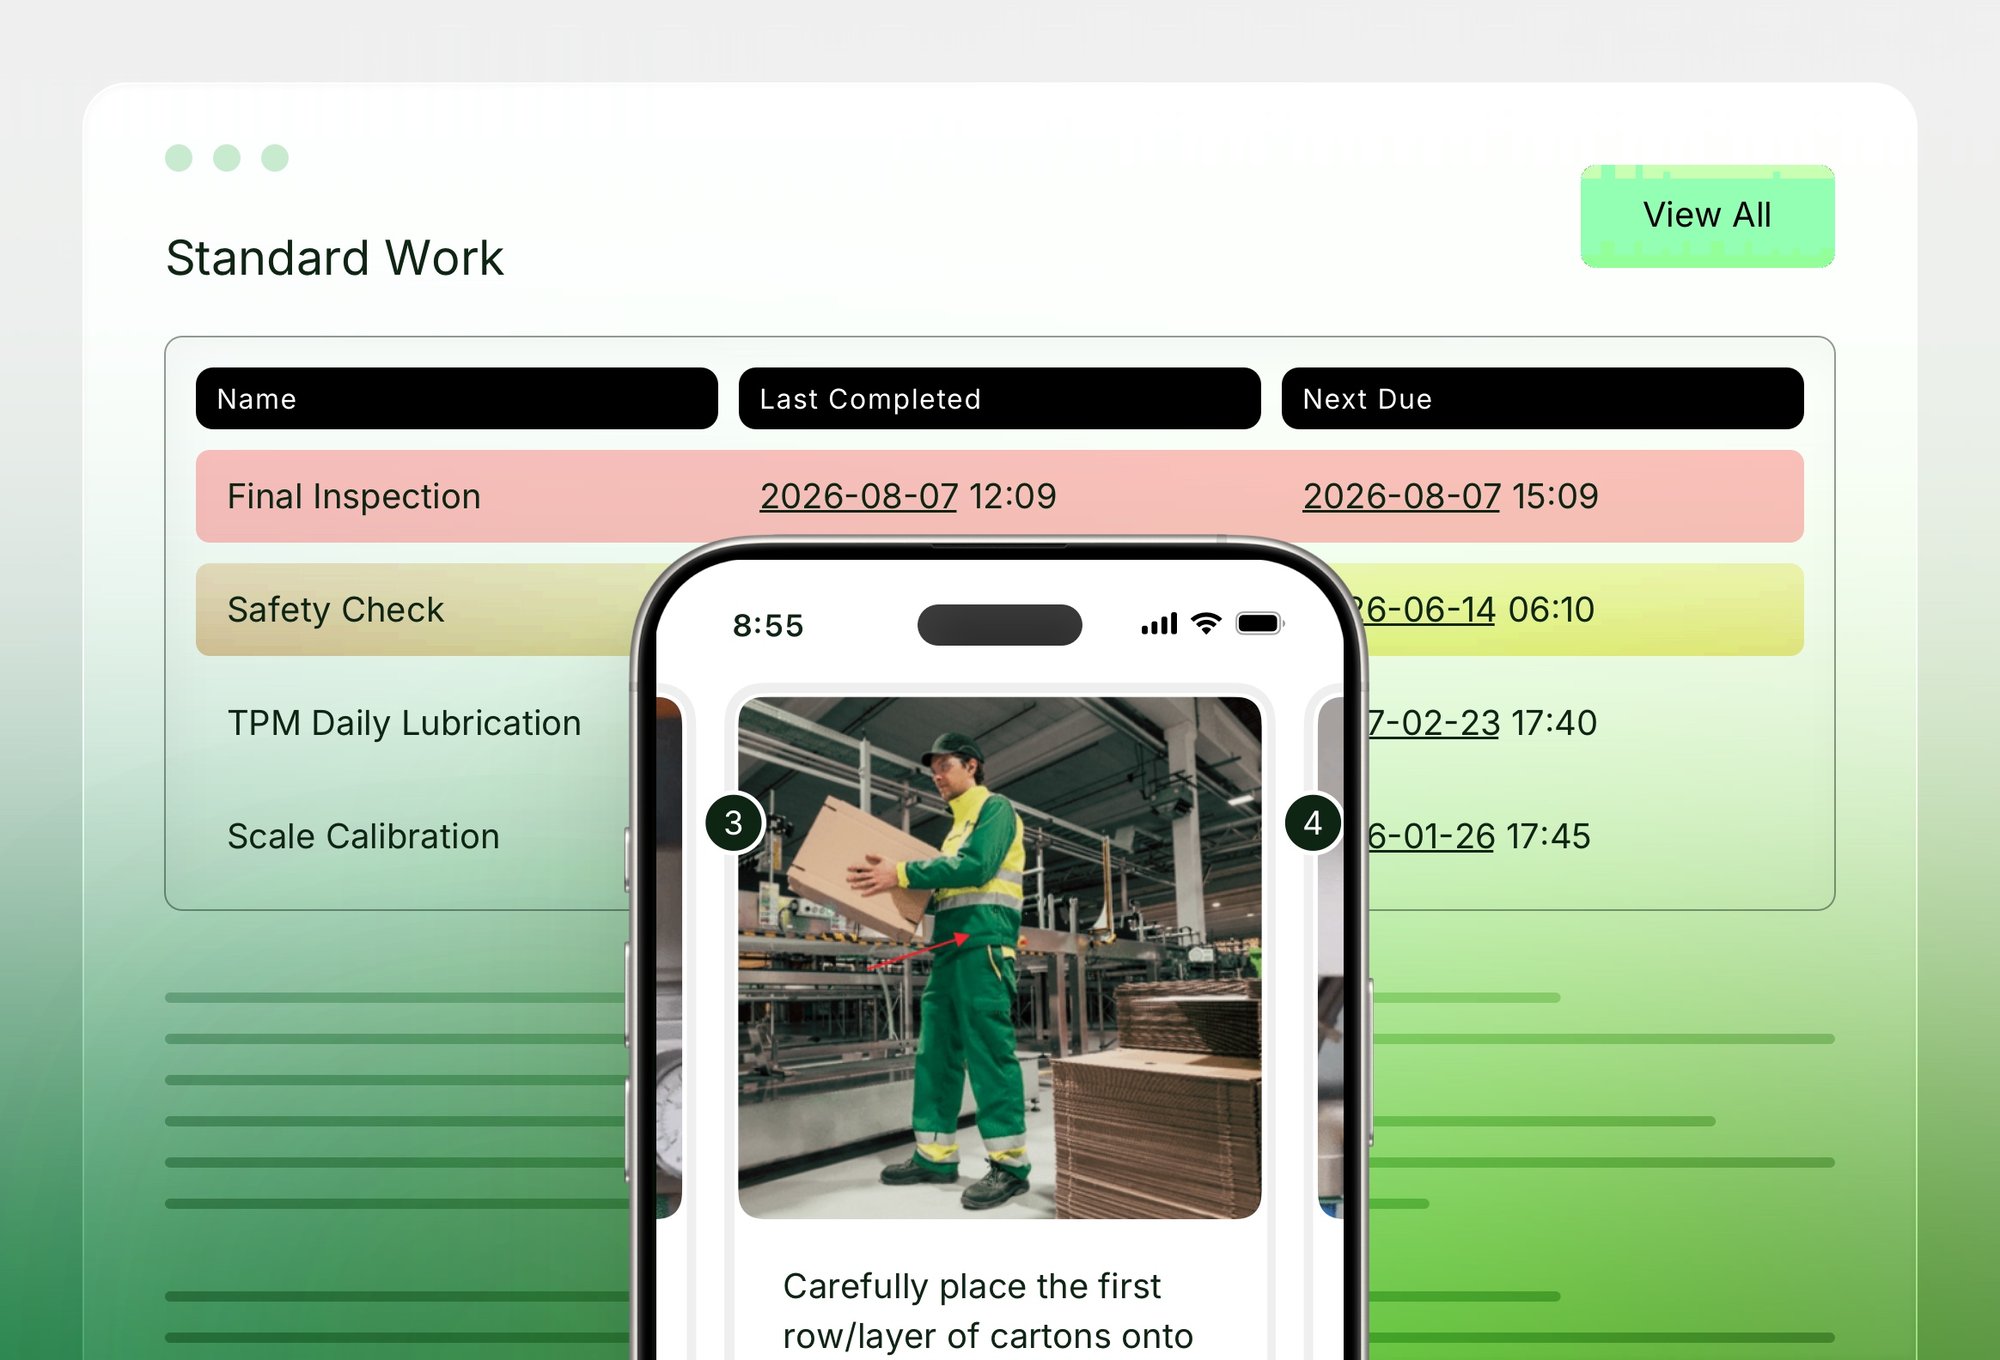
Standard Work & InstructionsPredictable standardizationPredictable standardization
-
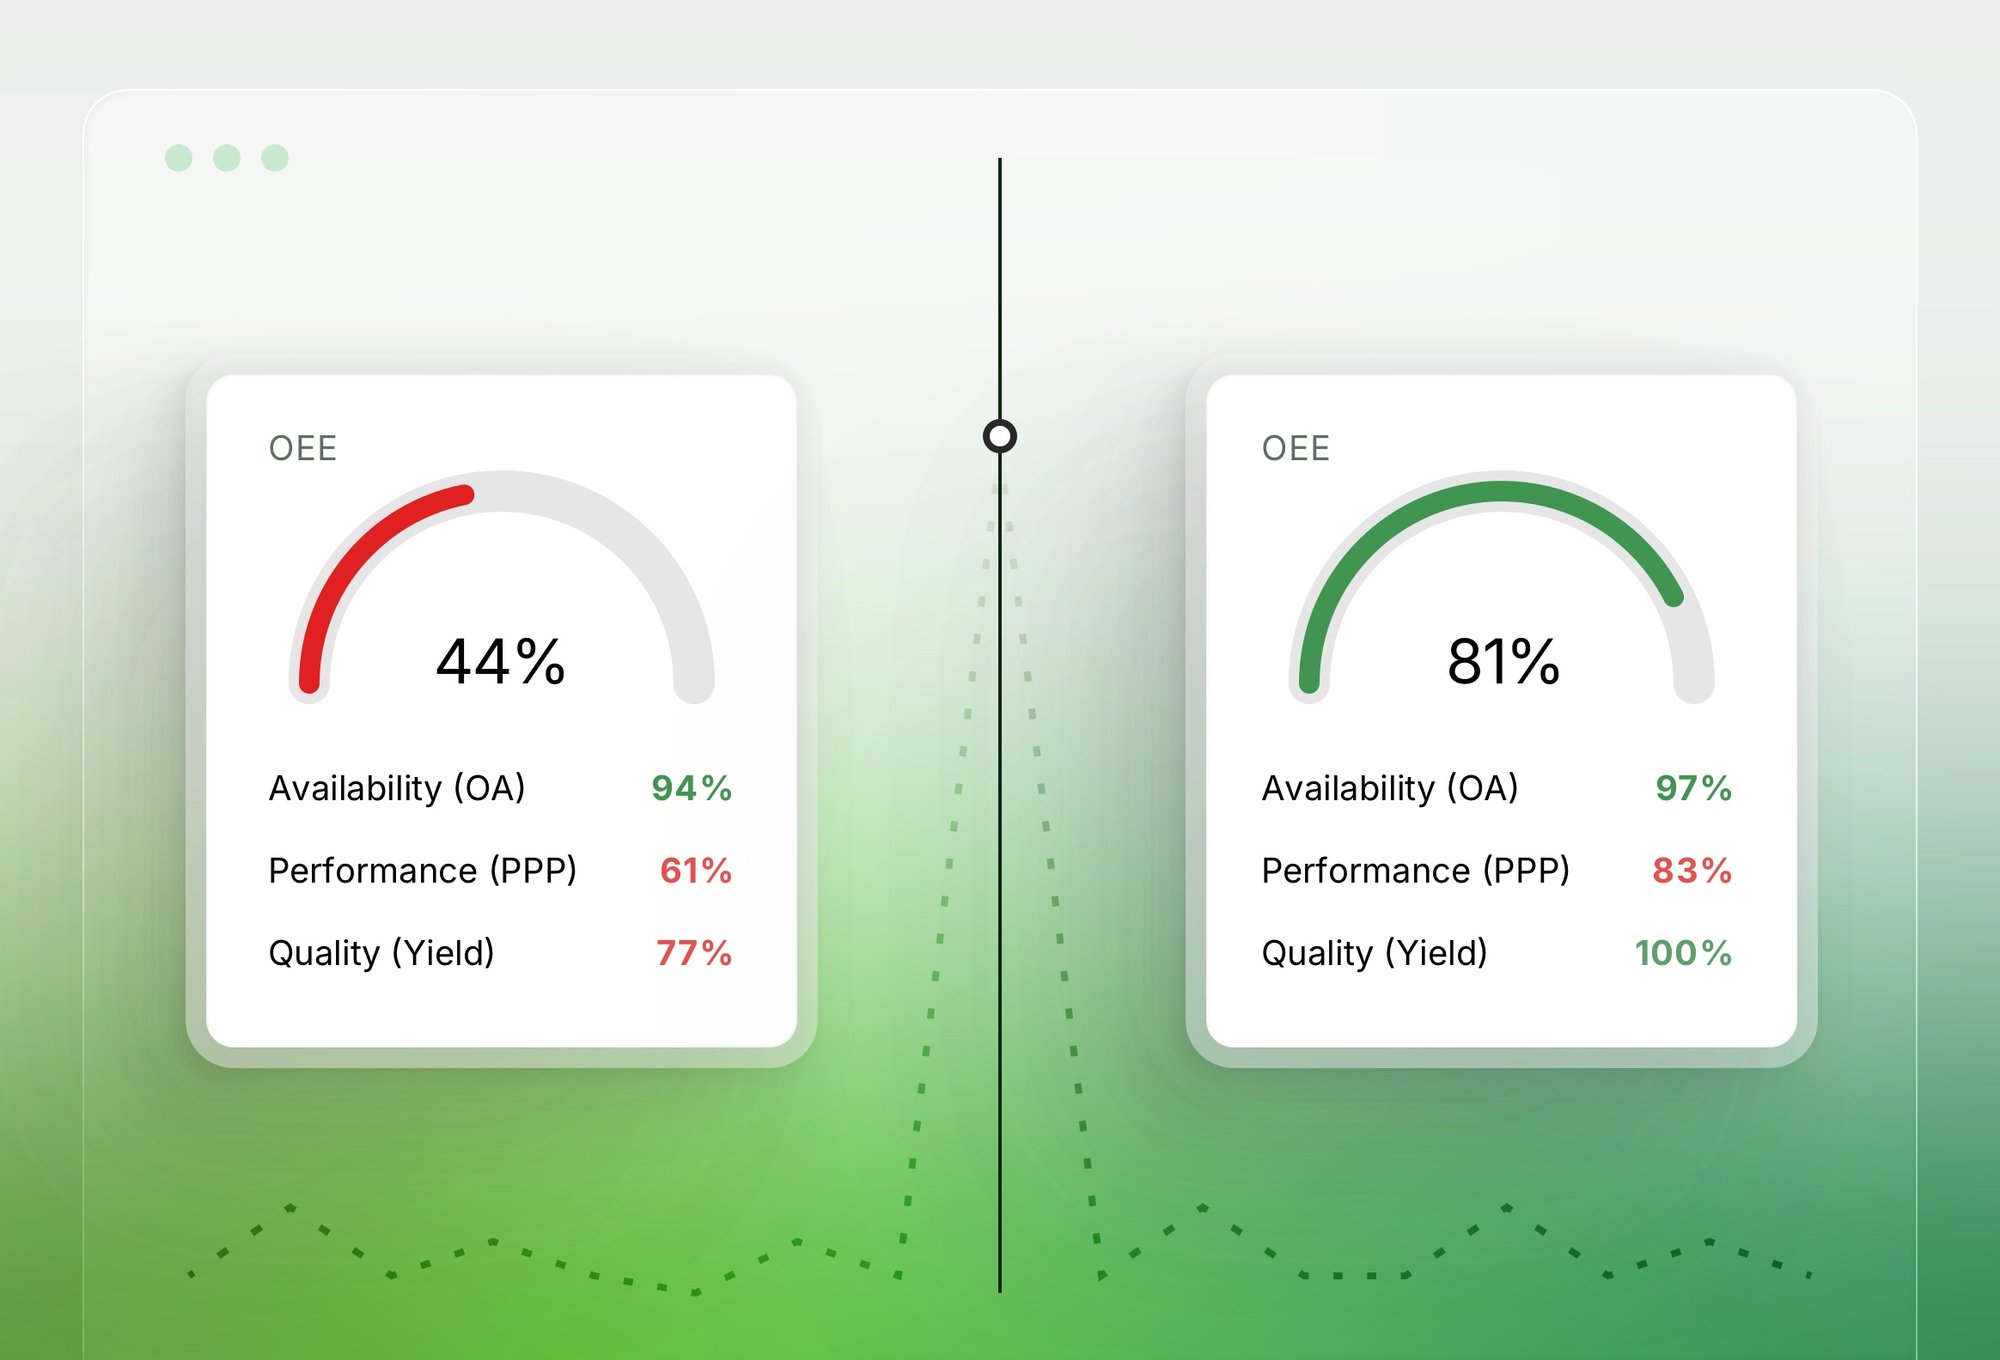
OEE MonitoringAPQ monitoring across sitesAPQ monitoring across sites
-
TeamBoardLive board for team meetingsLive board for team meetings
-
Cross-Site ComparisonCompare sites across the enterpriseCompare sites across the enterprise
Track Availability, Performance, and Quality as they happen, with the Six Big Losses built in.
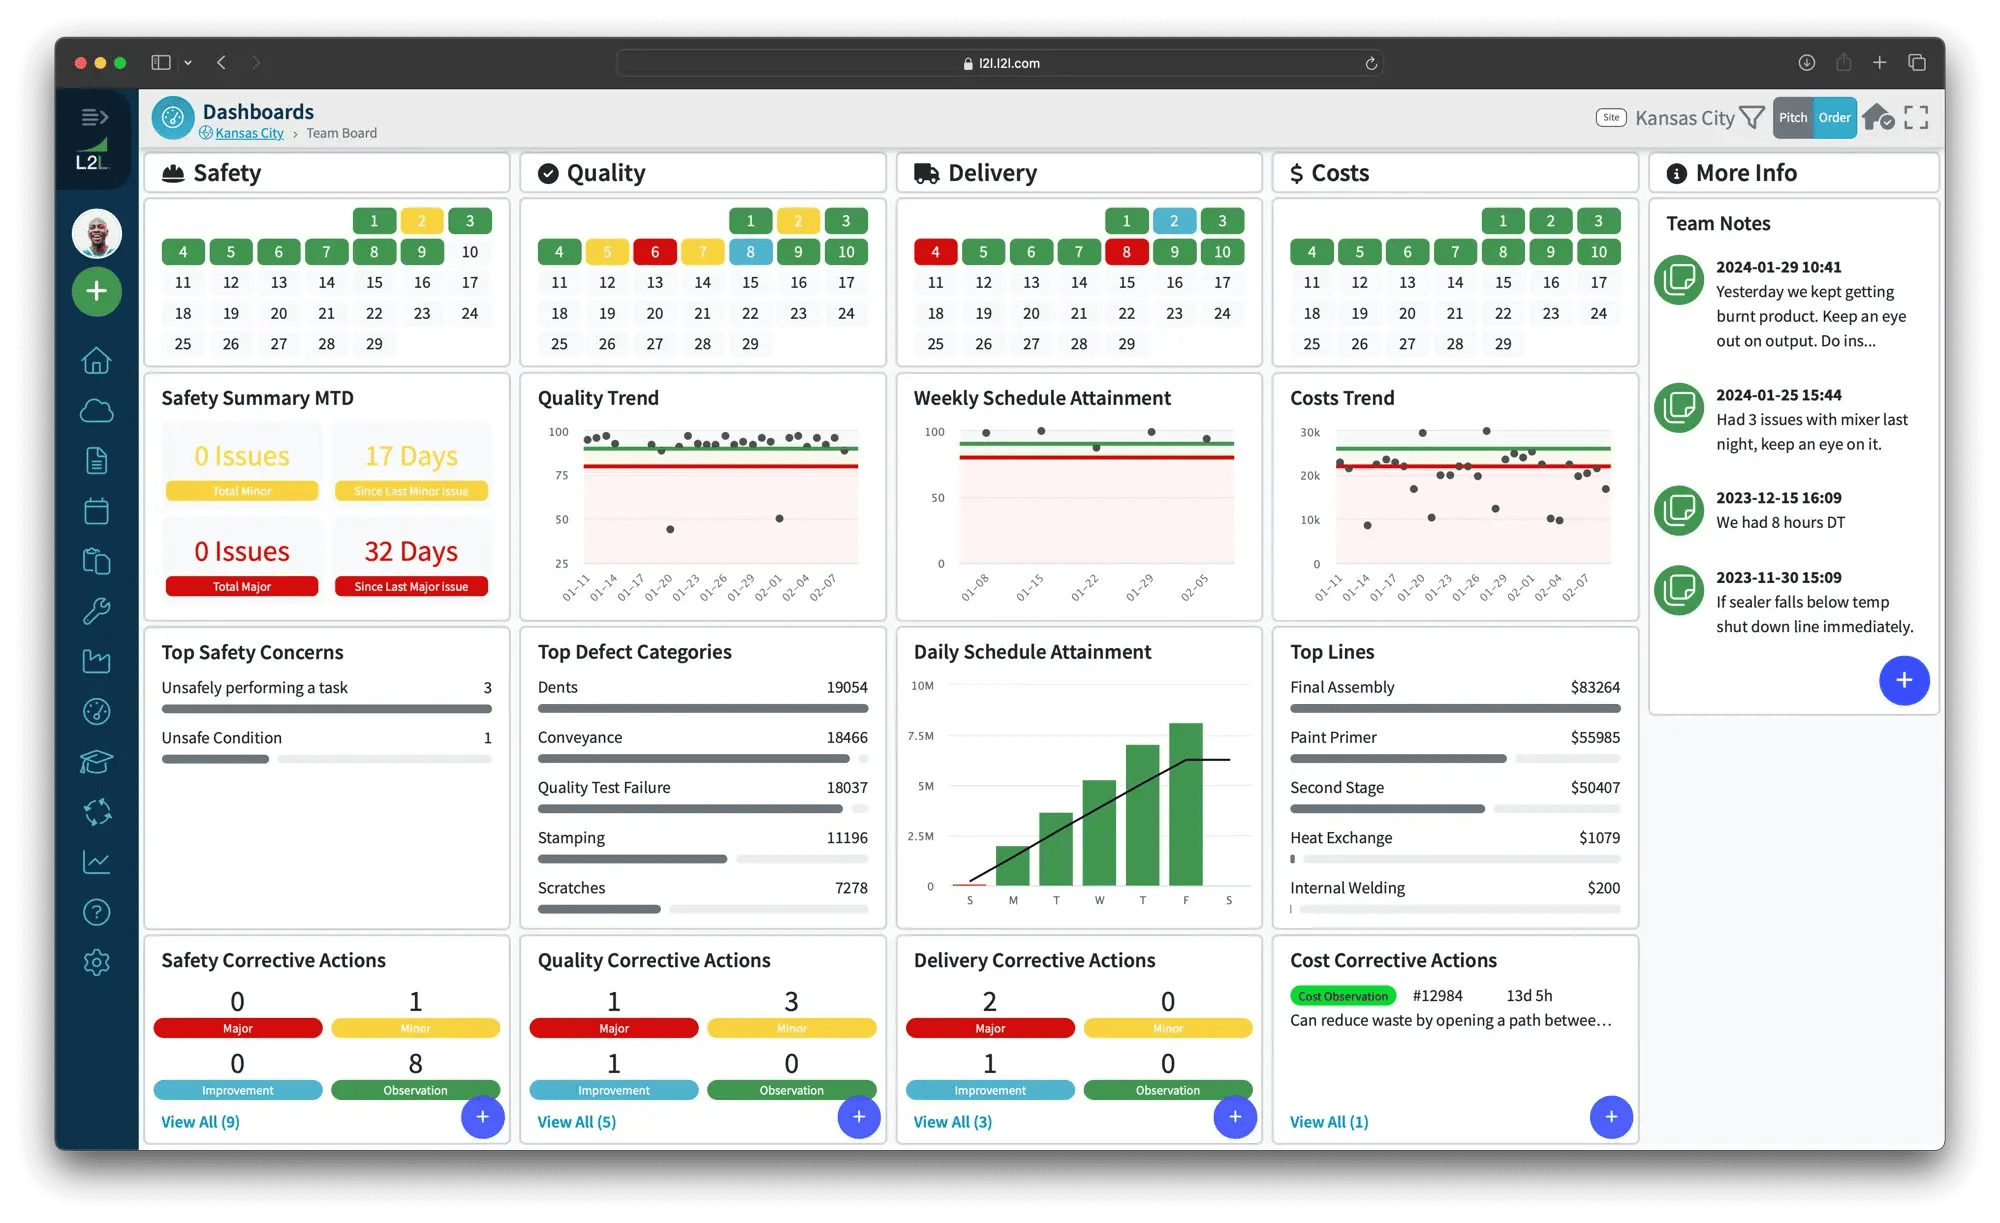
Run team meetings from a live board, so nobody searches for data before the huddle.
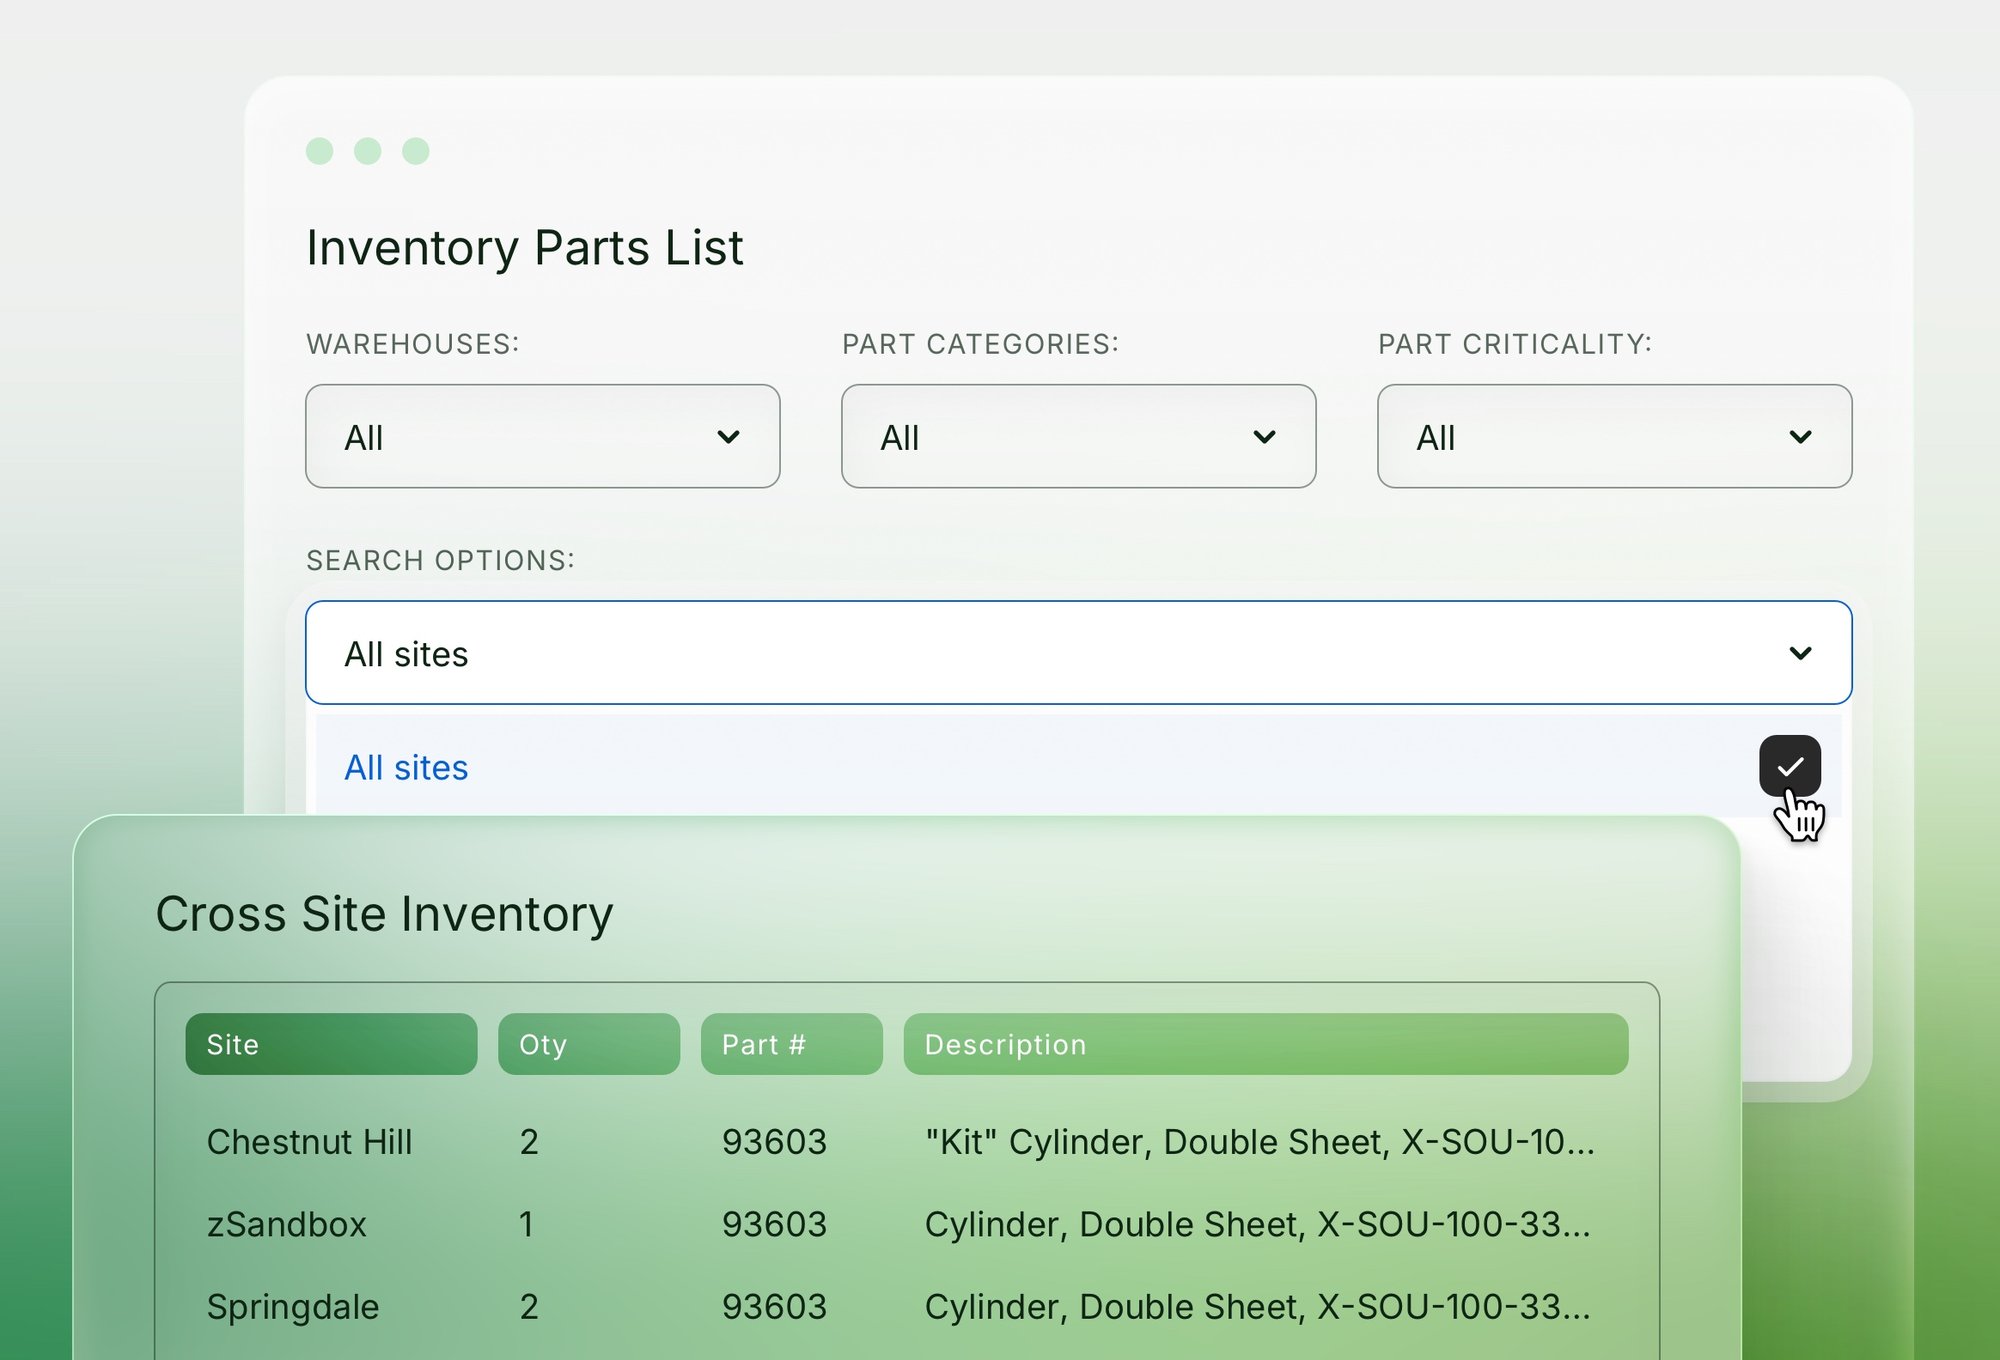
Compare plant performance across the enterprise and track the impact of improvement initiatives.
-
Standard Work & InstructionsPredictable standardizationPredictable standardization
build a procedure once and reuse it at every line and site, with guides and checklists on any device in any language. -
OEE MonitoringAPQ monitoring across sitesAPQ monitoring across sites
Track Availability, Performance, and Quality as they happen, with the Six Big Losses built in.
-
TeamBoardLive board for team meetingsLive board for team meetings
Run team meetings from a live board, so nobody searches for data before the huddle.
-
Cross-Site ComparisonCompare sites across the enterpriseCompare sites across the enterprise
Compare plant performance across the enterprise and track the impact of improvement initiatives.
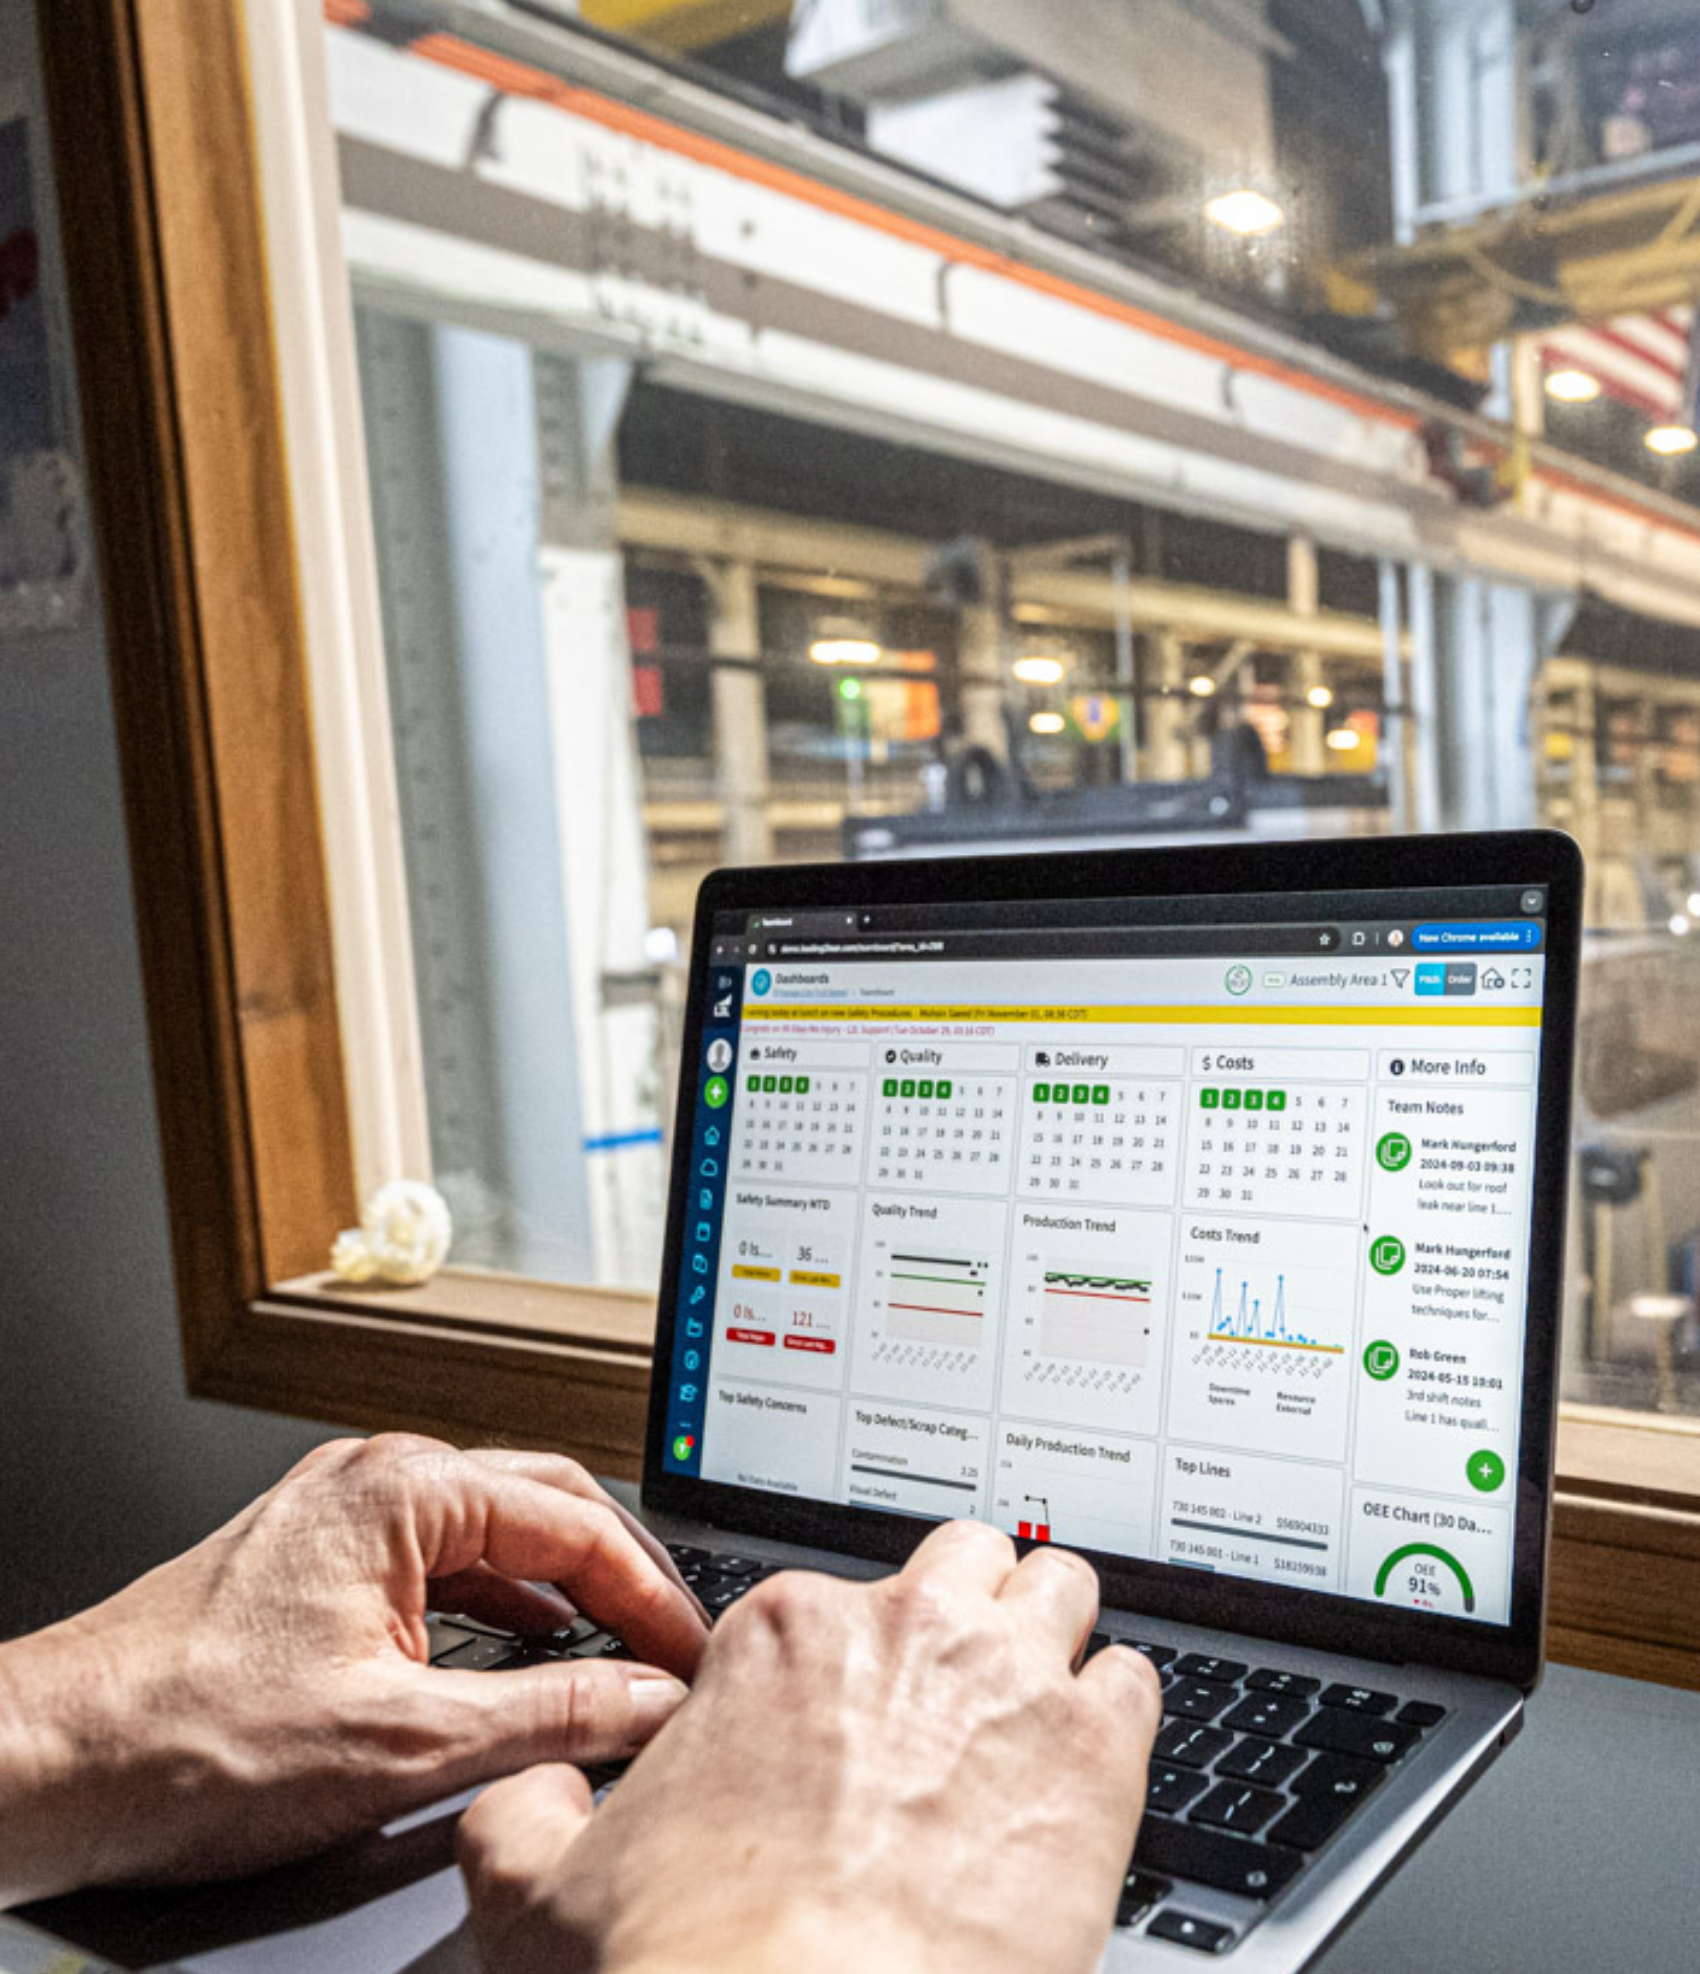
How L2L in real life
Check OEE and downtime cost by line ahead of a leadership ask. Review checklist and instruction completion across lines.
Jacob from Oetiker
“L2L makes production run more effectively. It’s not just focused on individual aspects, departments, or roles. L2L focuses on the value stream as a whole. It really got the lean concepts nailed down.”
Jason from Golden State Foods
“Now our operations are much more consistent. Between operators and even between shifts, we have one right way to do things.”
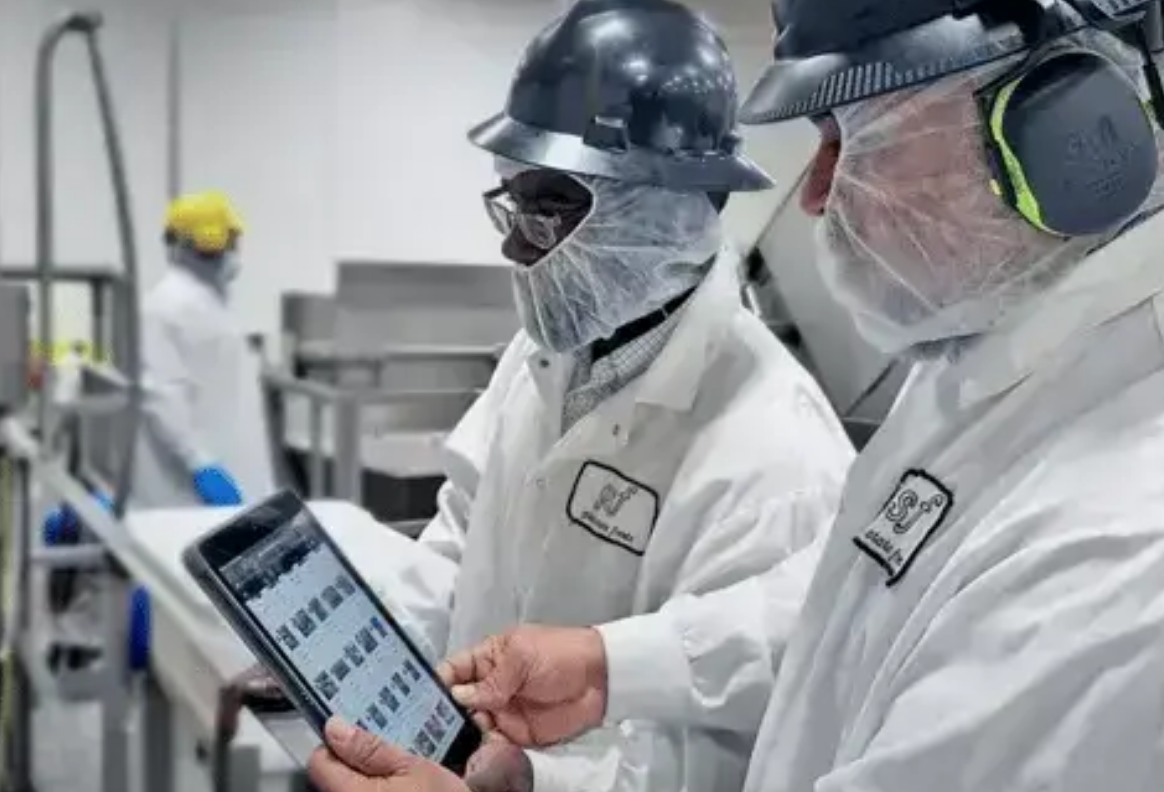
Jyoti from Thermo Fisher Scientific
“The mobile how-to guides and checks have excessively helped with reducing downtime, and we have seen our quality performance improve due to the guides we’ve created.”
Even better continuous improvement with the help of AI
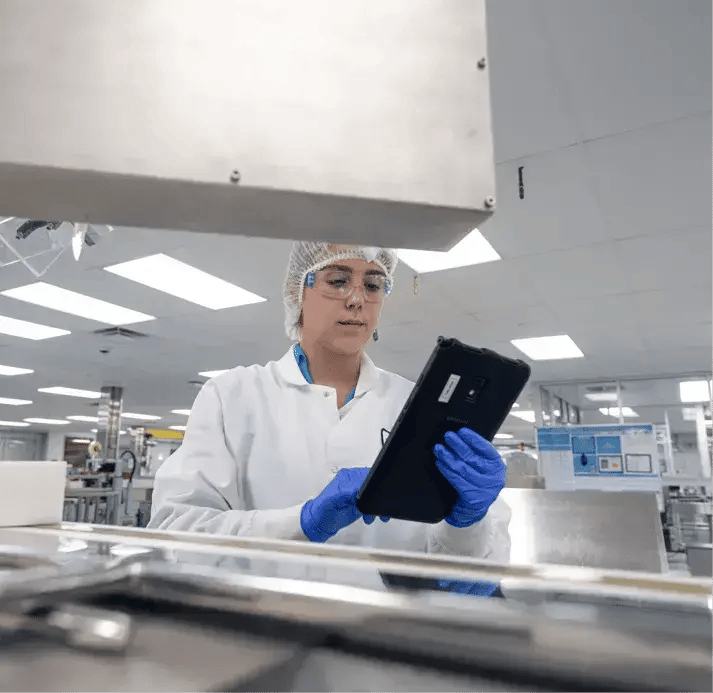
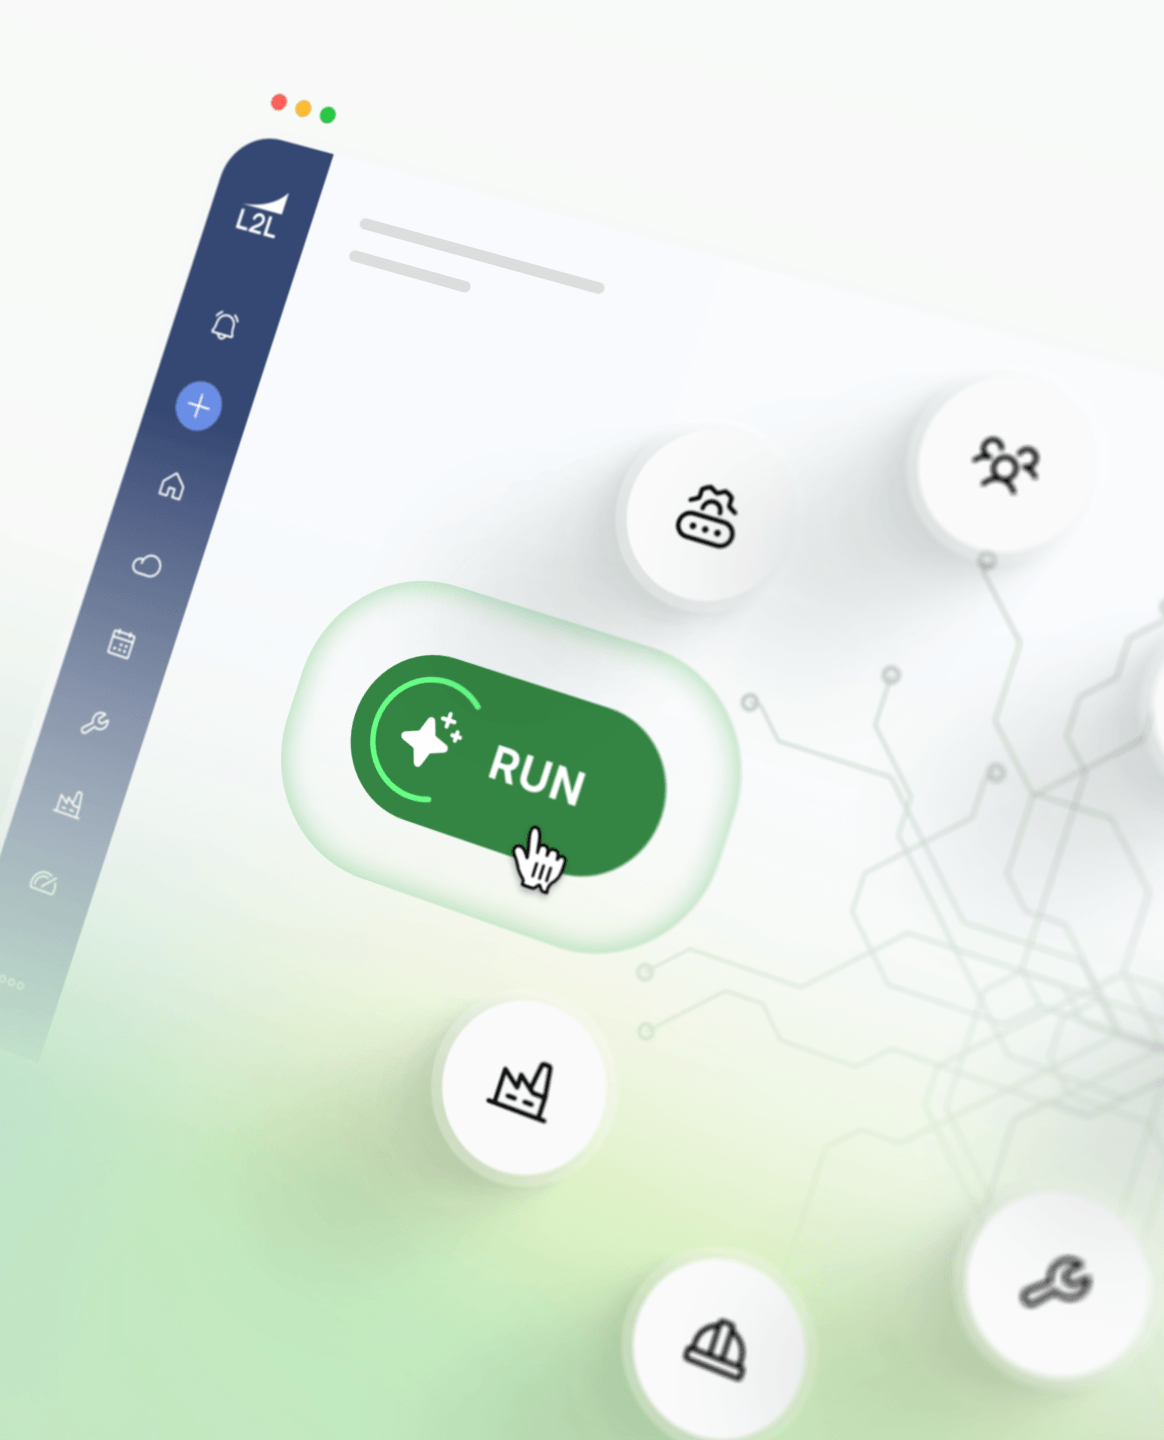
When the same issue keeps coming back, L2L Execution AI surfaces the pattern behind it and the likely root cause, so your team solves it once instead of every shift.
Your team makes the call, and AI helps turn the fix into standard work by converting existing SOPs into digital checklists and guides, so the improvement sticks across lines and sites.
More about continuous
improvement with L2L
L2L Manufacturing Intelligence
L2L’s manufacturing intelligence combines operational reporting with L2L Execution AI, so your teams see what happened on the floor and know exactly what to do next.
CASE STUDY:
HEINEKEN Reduced Training Time by 50%
See how HEINEKEN cut training time of new operators in half with better work instructions and skills management.
The Manufacturing Downtime Report
Want to save millions? Get to the root of unplanned downtime.
Alarming data: 60% of manufacturing leaders report six- and seven-figure losses from downtime alone.
Frequently asked questions about L2L for CI and OpEx teams
Does L2L support tiered escalation structures out of the box?
Yes. Set an escalation chain once, for example line lead immediately, supervisor at 30 minutes, area manager at 1 hour, and plant manager at 4 hours, delivered by text, email, Teams, or WhatsApp. Oetiker uses L2L TeamBoard to standardize its meetings across all its facilities.
Can we connect OEE metrics directly to cost and financial reporting?
L2L shows what each downtime event costs as it’s logged, and cost reports give Pareto and trend views of where money goes. The OEE Calculator estimates that each 1% of OEE can unlock $20K to $200K in annual savings per plant. L2L complements your ERP rather than replacing your finance system.
How do we standardize CI across sites without losing local flexibility?
Standardize the measurements and the work, not the plant. Every site uses the same OEE definitions, checklists, and instructions while keeping its own lines and machines. Then compare sites side by side and share fixes across plants.
What does a phased rollout look like for a CI-led implementation?
The L2L Method has three steps. Stabilize connects the frontline and sets a data baseline, Standardize digitizes standard work, and Optimize scales what works across sites. Oetiker piloted at one plant, saw OEE rise 11% in six months, then expanded to all ten facilities.
How is L2L different from a homegrown lean-tracking spreadsheet?
A spreadsheet records what happened after the fact. L2L ties improvement to live work, so issues, escalation, checklists, and instructions share one system and data is captured as work happens. BorgWarner cut a week of manual data analysis to 20 minutes.
Can L2L expand into quality or EHS use cases as our program matures?
Yes. L2L already supports audits, quality checks, and safety checklists, and it can integrate with QMS, LMS, safety, and EH&S systems.
Speak with a continuous improvement specialist
Discover how L2L connects your teams with real-time data and tools to reduce downtime through optimized manufacturing operations.
Manufacturing Intelligence