


 Shop floor execution
 Maintenance
 Production
 Skills
.svg) Execution AI
Execution AI
 Quality
 Training & Skills
 Building materials
 Packaging
 CMMS/EAM
 MES
MES
 Connected Worker
 Manufacturing Intelligence
 Case studies
 Blog
Blog
 Ebooks & Guides
 Webinars
 Events
 Downtime Cost Calculator
 Digital Maturity Assessment
 About Us
 Partners
 Newsroom
 Support
 Careers
 Trust center


Downtime Cost Calculator
Discover the value of Manufacturing Operations Management. Fill in the details below to analyze your downtime costs and uncover hidden productivity gains via the L2L Method.
Parameters
Configure your production metrics to analyze your downtime costs and Production Increase Potential.
Plant Information

Production Metrics
Your Downtime Cost Analysis
Downtime & Efficiency Potential Analysis
Enter your parameters on the left to generate your custom report.
Created
Potential
Created

Unlock the detailed breakdown and download the PDF report.
Enter your information to receive your customized report with comprehensive analysis and breakdown of potential savings.
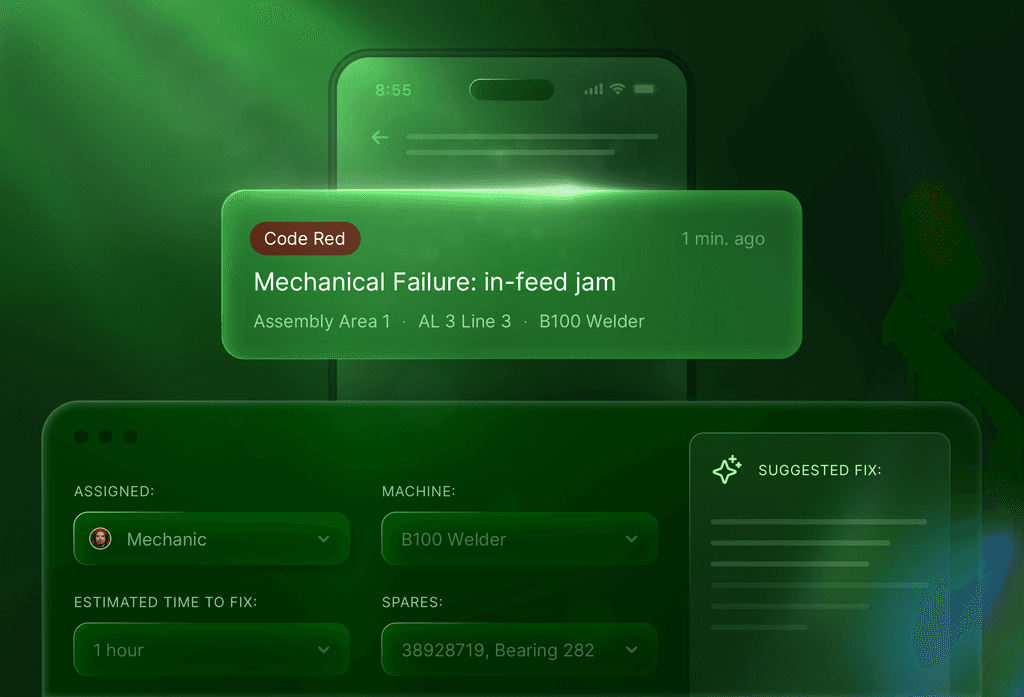
Where downtime tracking fails
Paper-based tracking distorts production data due to three common mistakes:
-
Inconsistent definitions of downtime across different shifts lead to skewed aggregate data.
-
Micro-stops disappear because operators don't have time to log them.
-
Changes in Ideal Cycle Times aren't updated, making the baseline inaccurate.
While this calculator is a good starting point, a live dashboard is what actually makes your data actionable.
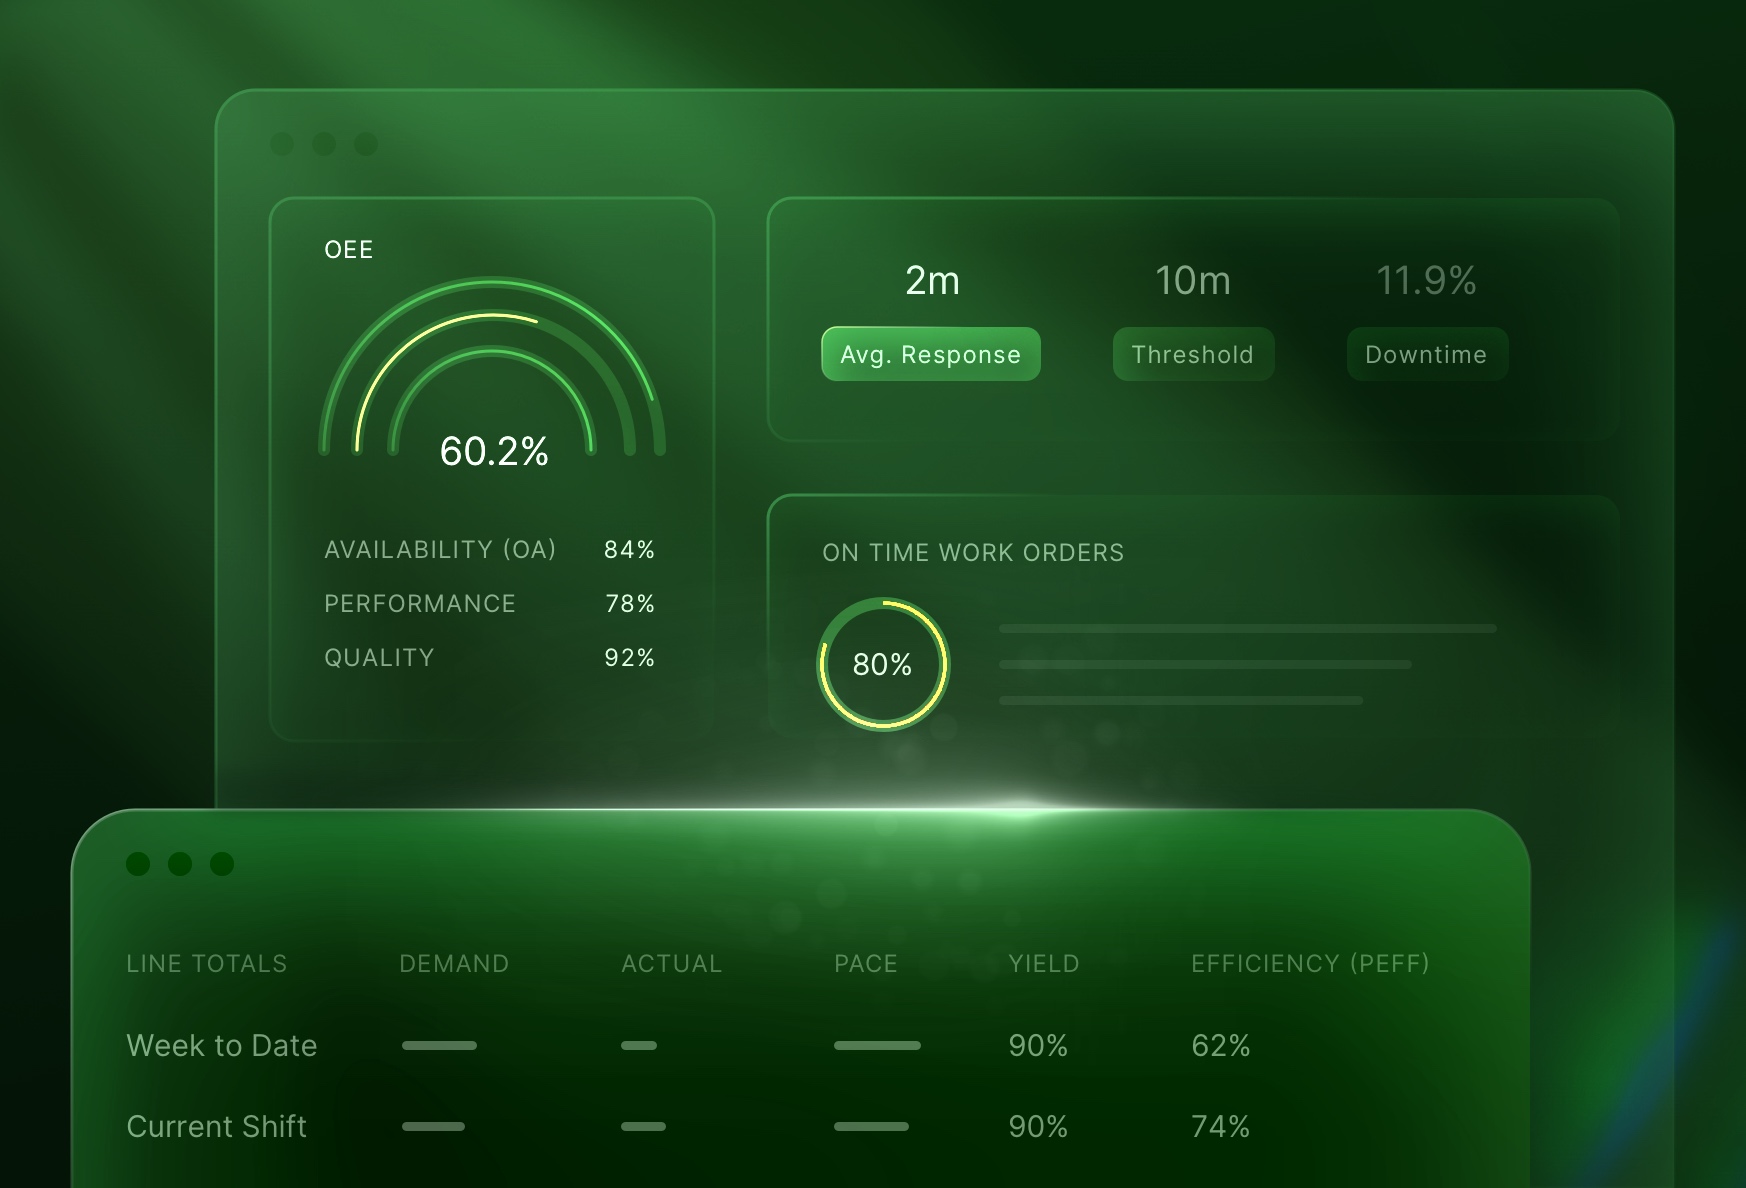
How L2L can help
-
Automatic data capture
-
Consistent definitions
-
Real-time dashboards
-
Six Big Losses built in
-
Connected response
From measurement
to value
Measuring your baseline is only the first step. To secure funding for improvements, you must translate operational data into actual financial value.
.svg)
