

WEBINAR SERIES
Shop Floor Chronicles: Real Stories, Battle-Tested Fixes, and Actionable Results.
Contact Us
Contact Us
OEE SOFTWARE

OEE you can confidently verify

Every 1% increase in OEE can unlock hundreds of thousands in annual savings per plant. OEE software should show you exactly where that percentage is being lost, in real time, not in a manual report calculated too late to act on.

OEE software to take you further

Automate data capture, use consistent definitions, and get visibility into the Six Big Losses in real time. 
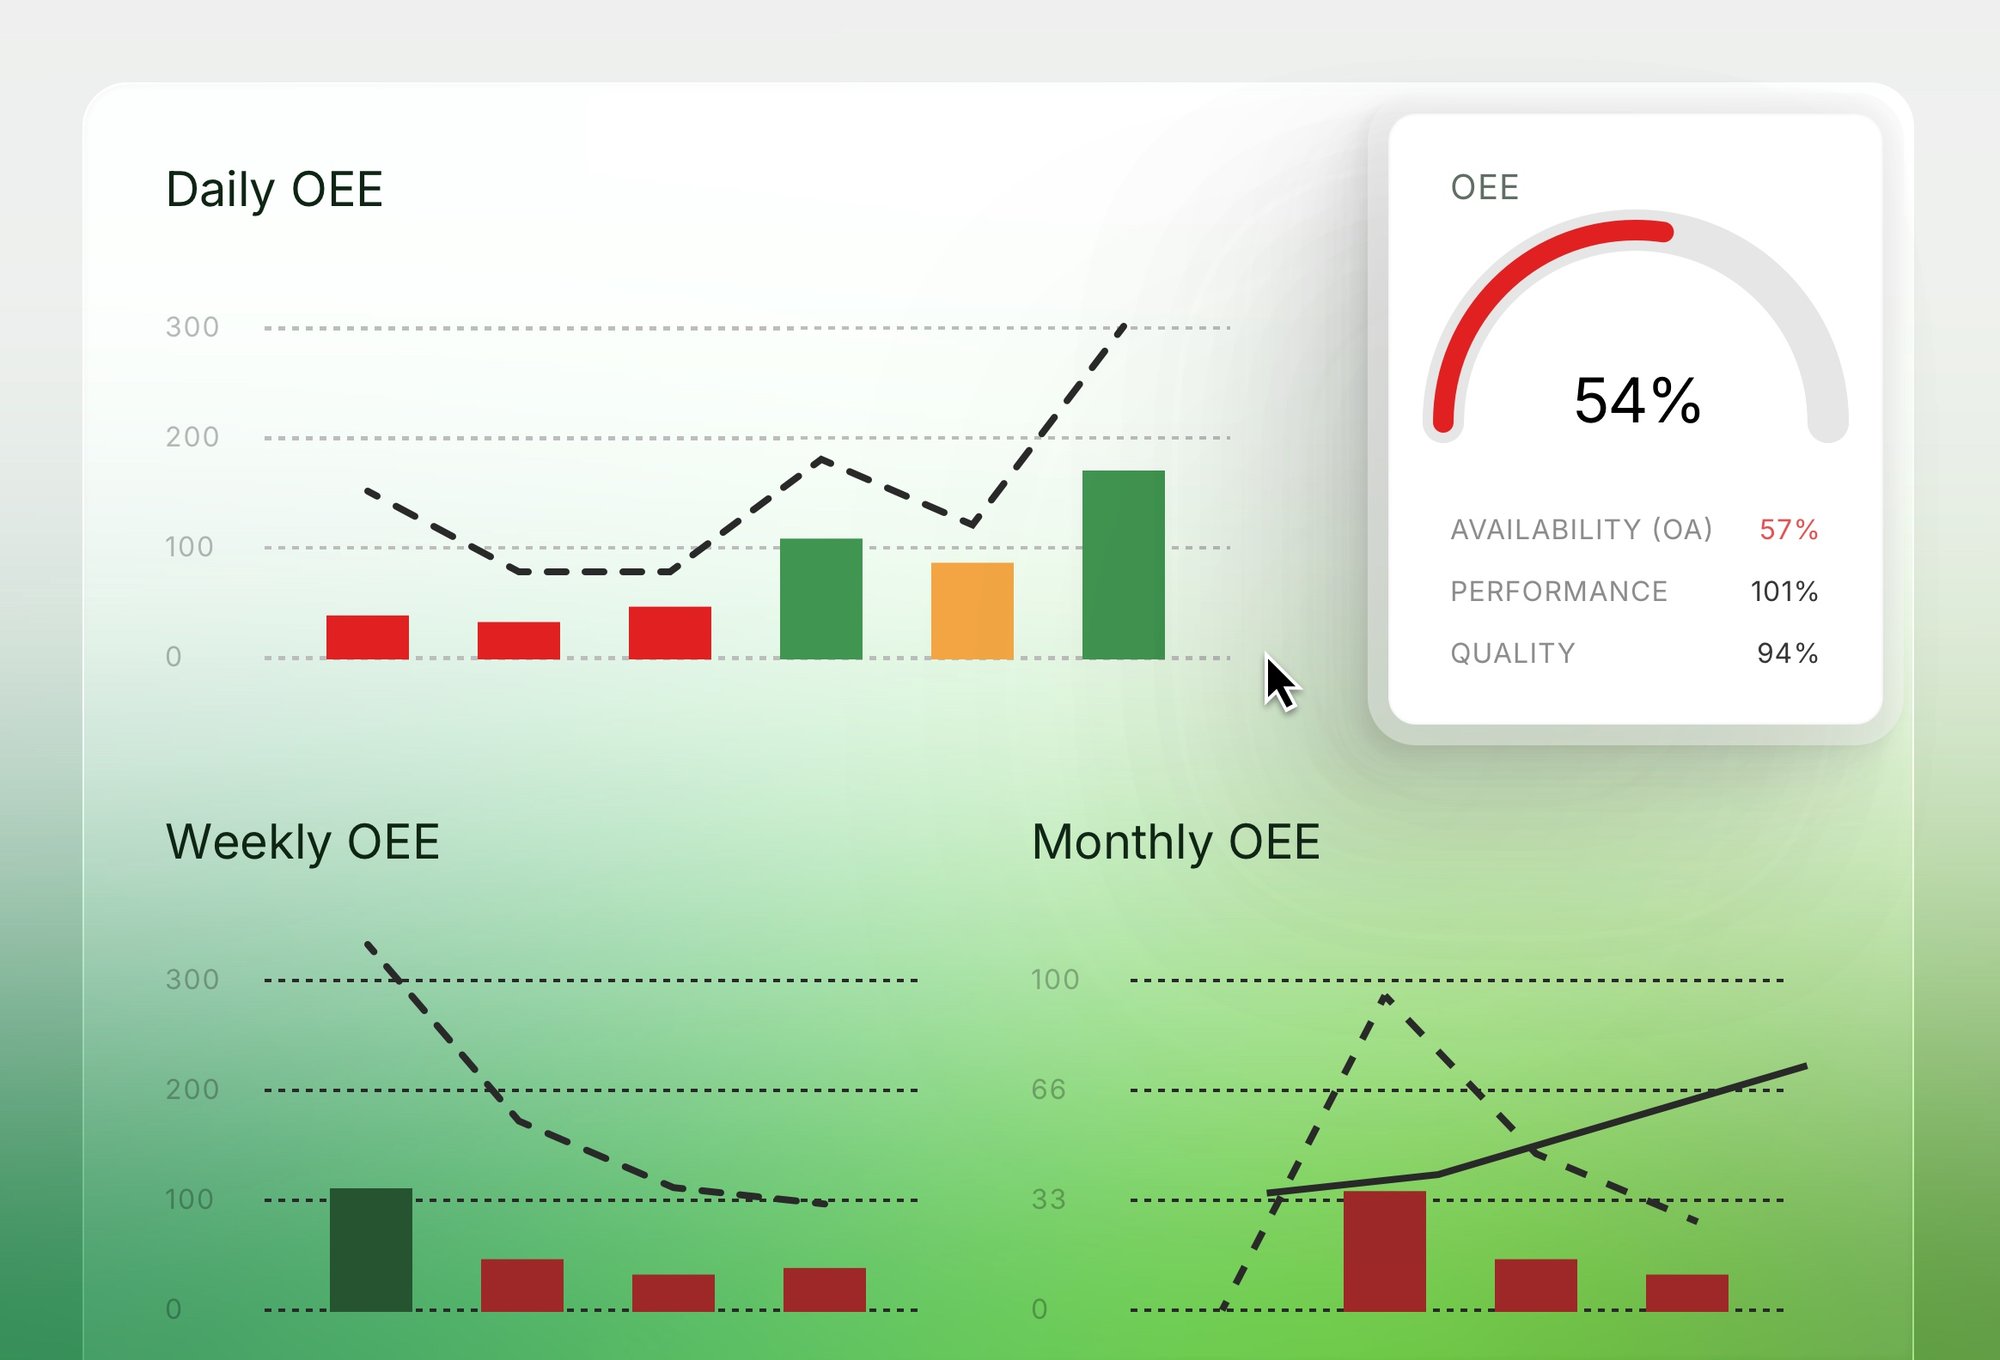
Data capture for OEE

OEE calculates from real production data as it happens, so downtime definitions, micro-stops, and cycle time baselines stay accurate and consistent, without depending on someone remembering to write it down.
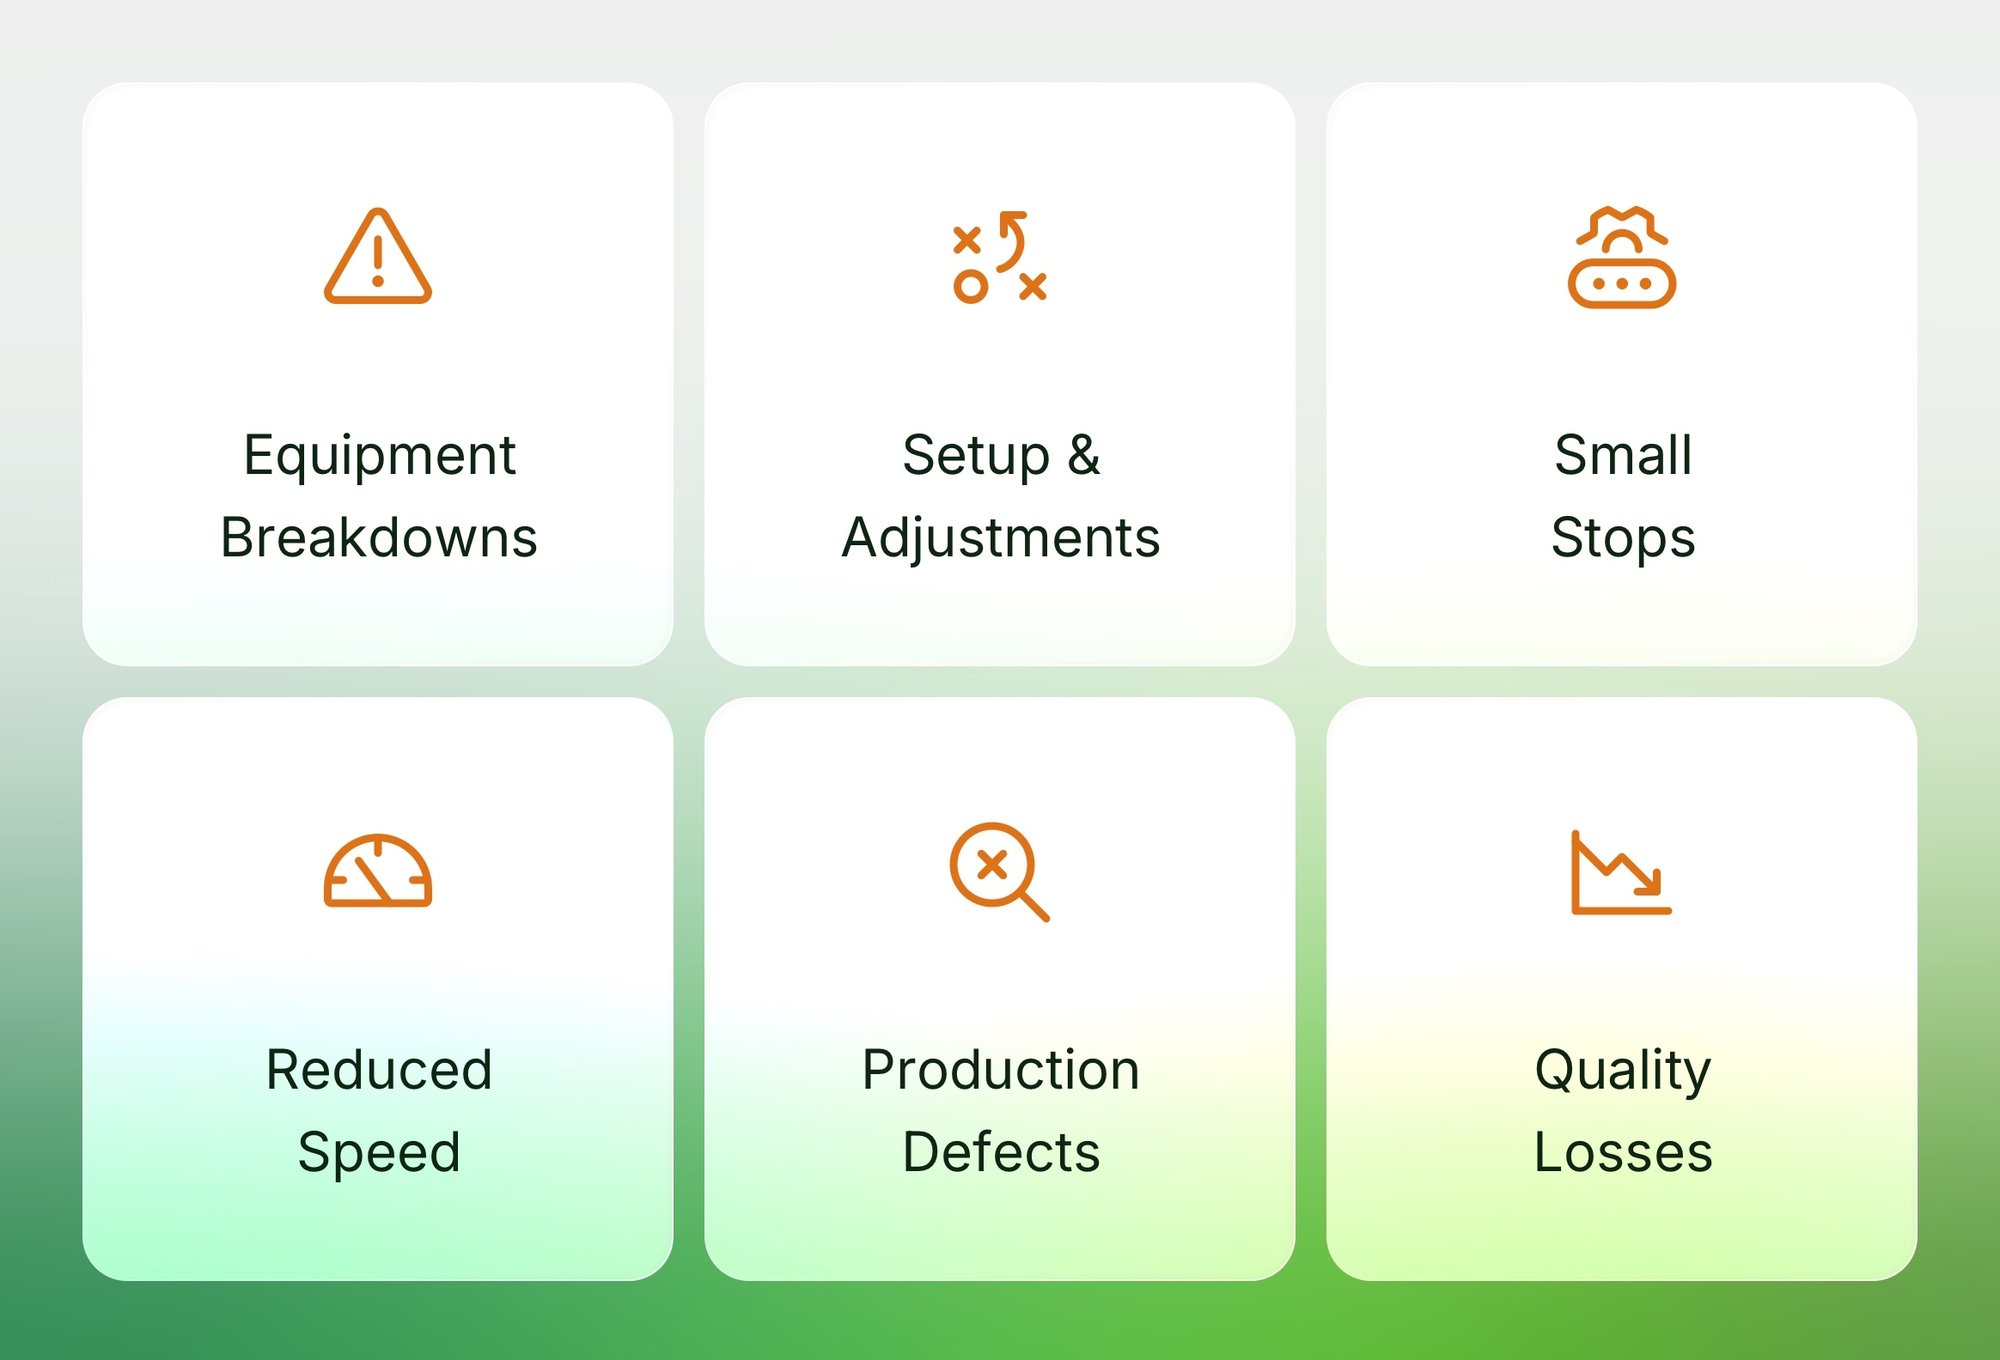
The 6 big losses

See exactly which loss category—unplanned stops, micro-stops, or quality rejects—is driving your score, so a low number points straight to a specific fix.
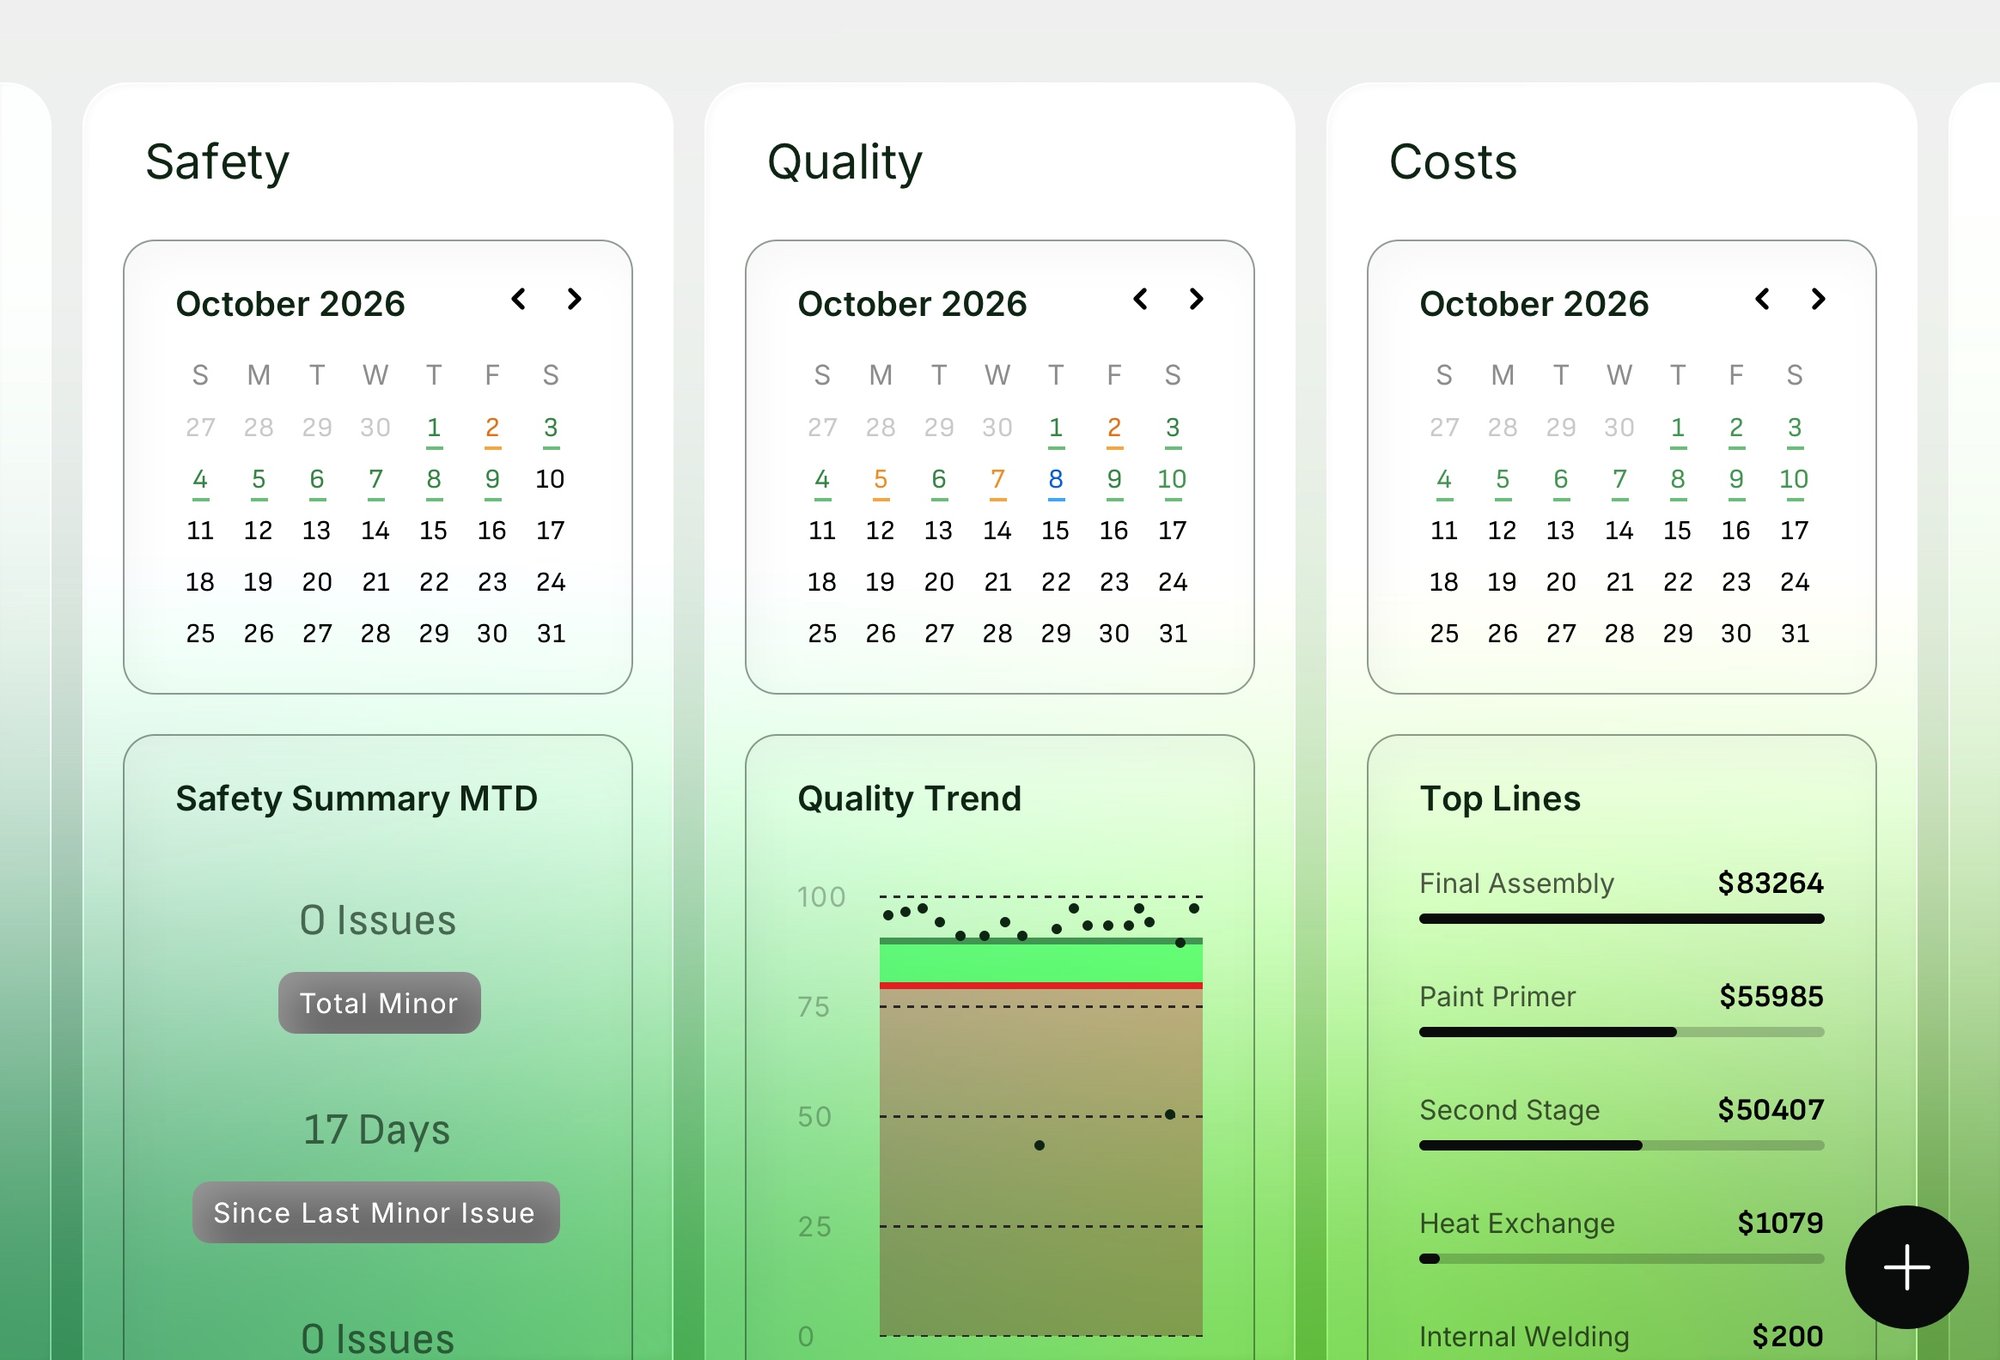
 

Real-time OEE

OEE surfaces as it happens, connected to automated dispatching, so a drop triggers an immediate response instead of a report reviewed after the shift's already over.

FEATURES

Features for reliable OEE calculations

Connected across your maintenance and production operations.

Automatic Data Capture

OEE is calculated from real production data as it happens, not from a manual log someone fills out per shift.

Reconciling OEE Formula

Availability × Performance × Quality always equals OEE, with no hidden exclusions distorting the math.


Availability Losses

Catch breakdowns and equipment failures the moment they happen, and standardize changeovers. 

Performance Losses

Spot small stops and idling (minor stops under ~10 minutes, no repair needed) and slow running against your ideal cycle time, before they add up to a real speed loss.

Quality Losses

Separate startup rejects (defects during warmup) from production rejects (defects during steady-state run), so you know whether the problem is your process or your startup routine.

Consistent Definitions

Downtime and cycle time definitions stay consistent across shifts and sites, so aggregate data isn't skewed by inconsistent logging.

Real-Time Dashboards

See OEE as it happens, connected to automated dispatching, instead of a report compiled after the shift ends.

Data Gap Flagging

Missing Ideal Cycle Time data surfaces directly in Daily and Weekly Production Summary reports.

Historical Consistency

Metric logic updates apply to historical data too, so past and present numbers stay comparable.

Digital SQDC Board

See OEE alongside Safety, Quality, Delivery, and Cost data in one real-time board, built for how tier meetings actually run.

Improved OEE by +11% in 6 months

Jacob Reid, Director of Global Engineering

"L2L makes production run more effectively. It's not just focused on individual aspects, departments, or roles. L2L focuses on the value stream as a whole. It really got the lean concepts nailed down."

Oetiker_L2L (1)

Increased OEE

Verified User, Quality Auditor, Enterprise, G2 review

"L2L empowers our team to make data-driven decisions that directly increase OEE."

Operations_leaders_-_manufacturing_intelligence_50

Really good at data gathering

Verified User in Automotive

"I believe the L2L platform is really good at data gathering, with the reports menu I can get any information needed from OEE, OA or even filter by Dispatch Type, all this data is needed for my KPI's."
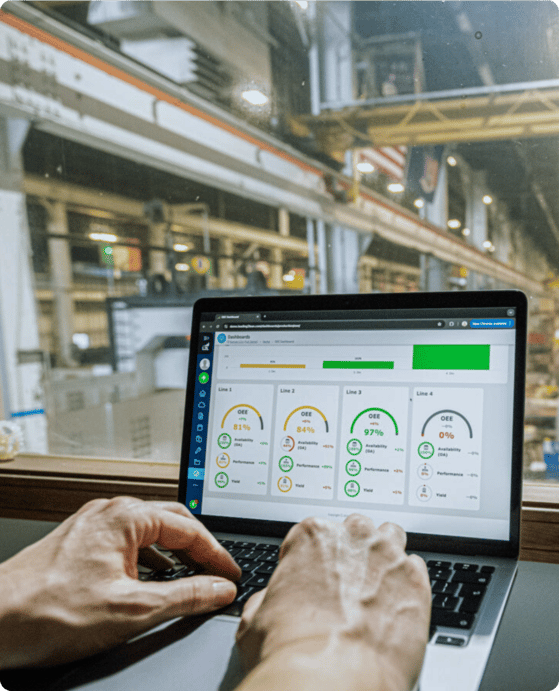
OEE_report_manufacturing_intelligence_48
+ 53 %
more productive
+ 15 %
OEE
+ 38 %
operational availability
AI-POWERED MANUFACTURING INTELLIGENCE

Shift-by-shift optimization

L2L Execution AI delivers instant answers to complex data challenges. 

Use our library of out-of-the-box Solvers (or create your own) to sort out OEE challenges, diagnose disruptions, and give your team the solutions they need to win every shift.

RELATED CONTENT

More about improving your OEE

How to Improve OEE

A Practical Guide to Attacking the Six Big Losses.

Manufacturing Intelligence 2.0

Manufacturing intelligence that tells you what to do next.

West Liberty Foods: +10% OEE

See how West Liberty Foods increased visibility into plant operations and improved operational availability (OA) and OEE. 

CALCULATE YOUR OEE

What is your OEE?

Get an instant OEE breakdown across Availability, Performance, and Quality, plus where you land against world-class benchmarks. Every 1% of OEE can unlock $20K to $200K in annual savings per plant.

FREQUENTLY ASKED QUESTIONS

FAQ about OEE software

What is a good OEE score?

While 85% is widely cited as world-class, the typical factory averages around 40-60%. The goal should be steady improvement against your own baseline rather than chasing an arbitrary industry benchmark.

How is OEE different from TEEP?

TEEP (Total Effective Equipment Performance) measures utilization against a full 24/7 calendar year. OEE only measures utilization against scheduled Planned Production Time.

Why would a Performance score go above 100%?

That indicates the Ideal Cycle Time baseline is inaccurate. The system thinks the machine is running faster than is physically possible.

How often should OEE be calculated?

Manual calculations are usually done per shift or weekly, which is often too late to act on. OEE software calculates it in real time, so a drop can trigger a response immediately.

Does OEE software replace manual OEE calculation entirely?

Yes, OEE software can replace manual calculation completely in a well-built system. OEE software can capture, calculate, and visualize OEE data in real time, turning a static percentage into automated maintenance and production workflows.

Ready to see what modern OEE software can do?

L2L eliminates downtime and increases productivity. Our platform delivers real-time guidance to frontline teams, unified control for operations leaders, and measurable insights for global executives.