


 Shop floor execution
 Maintenance
 Production
 Skills
.svg) Execution AI
Execution AI
 Quality
 Training & Skills
 Building materials
 Packaging
 CMMS/EAM
 MES
MES
 Connected Worker
 Manufacturing Intelligence
 Case studies
 Blog
Blog
 Ebooks & Guides
 Webinars
 Events
 Downtime Cost Calculator
 Digital Maturity Assessment
 About Us
 Partners
 Newsroom
 Support
 Careers
 Trust center


For most plant managers, walking the floor reveals a familiar paradox: machines are humming, teams are moving, yet the monthly metrics show production is falling short of its true capacity. Industry benchmarks reveal that the average manufacturing facility operates at around 60% Overall Equipment Effectiveness (OEE). While a 60% score indicates a plant is stable, it also means a massive amount of hidden capacity is locked behind operational friction.
Discovering how to improve OEE isn't a matter of staring at a digital dashboard or waiting for a post-shift report. Real performance gains don't come from tracking a metric. Instead, they come from aggressively attacking the specific losses that cause that metric to drop. To drive sustainable operational excellence, leaders must stop treating OEE as a passive scorecard and start using it as a live diagnostic tool.
A quick OEE improvement blueprint:
- The baseline: The typical plant stalls at 60% OEE because operators spend up to 50% of their time chasing information instead of running production.
- The target: True optimization requires moving away from blanket mandates and focusing on the “Six Big Losses” using the Pareto principle, or the “80:20 rule.”
- The solution: Real-time visibility combined with an automated system of action turns raw performance data into immediate, guided frontline execution.
What OEE actually tells you
At its core, OEE is calculated by multiplying three fundamental manufacturing dimensions:
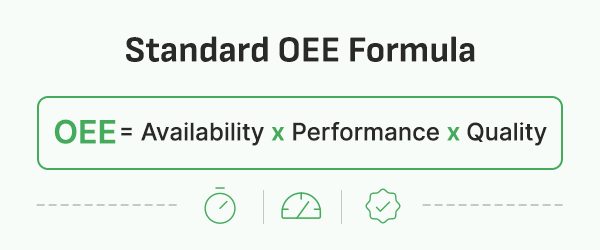
OEE shouldn’t be treated as a scoreboard to please corporate executives. Instead, it’s a diagnostic compass. Learn how to improve OEE by attacking the Six Big Losses across availability, performance, and quality, and turn each loss into action. When a machine's efficiency drops, the number itself doesn't solve the issue. It simply points you toward the operational friction that needs to be eliminated.
Why most plants stall at 60% OEE
It’s common for manufacturing operations to plateau at a 60% efficiency threshold. When plants get stuck here, the bottleneck usually isn’t a lack of data. In fact, most modern plants are drowning in IoT data, sensor alerts, and legacy software notifications.
The real blocker is execution speed. Research shows that the average industrial worker can spend up to 50% of their week simply chasing down information. This includes walking the floor to find a supervisor, searching for maintenance histories, or manually logging downtime events on paper clipboards.
When half of a shift is lost to administrative tracking and communication lags, performance stalls. You can’t improve performance until you eliminate the delay between a shop-floor signal and its ultimate resolution.
Start with the Six Big Losses
To break through your production ceiling, you have to break down your losses. The manufacturing industry categorizes shop-floor waste into the “Six Big Losses.” Managing them requires using the Pareto principle:
- Identify the single largest loss category on your line.
- Focus your continuous improvement teams there.
- Don't move to the next category until the first one is stabilized.
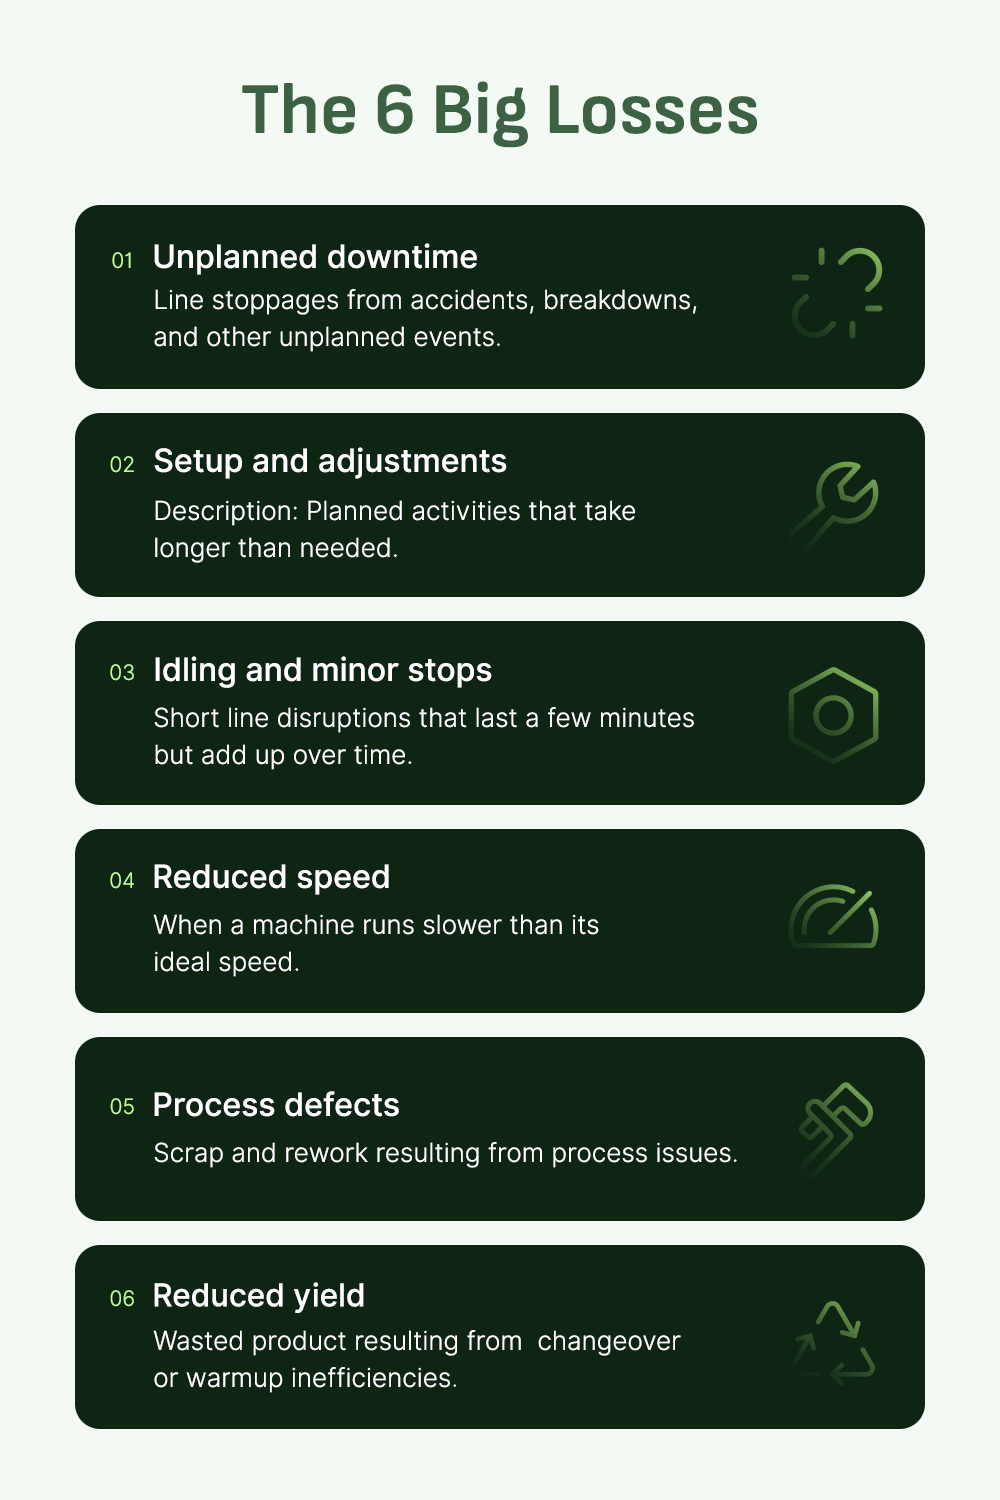
Availability losses: breakdowns and changeovers
Availability losses directly rob a plant of its planned production time. They occur in two distinct ways:
- Unplanned downtime: Catastrophic mechanical failures, blown fuses, or sudden part breakages that halt production entirely.
- Setup and adjustments: Mismatched changeovers, warm-up periods, and tooling adjustments that keep a machine idle between product runs.
Reducing these losses requires moving away from tribal knowledge and implementing standardized, digital work instructions to accelerate setup times.
Performance losses: minor stops and reduced speed
Performance losses represent the “hidden factory”—the subtle slowdowns that rarely get recorded in manual logs but kill your daily throughput:
- Idling and minor stops: Brief disruptions, such as a machine jam or a sensor misalignment, that last less than two minutes and are quickly cleared by an operator.
- Reduced speed: Running an asset below its ideal nameplate cycle time because a component is wearing out or because operators don't trust the machine at full speed.
These losses can only be uncovered through real-time machine-state capture that tracks every second of execution.
Quality losses: defects and startup rejects
Quality losses represent a double penalty: they waste both raw materials and valuable machine capacity time:
- Process defects: Scrap parts, rework, and attribute failures generated during steady-state production.
- Reduced yield: Startup rejects and stabilization waste produced during machine warm-ups or immediately following a tooling changeover.
Optimizing this dimension requires tightly linking asset health to first-pass yield tracking.

Seven strategies to improve OEE
Implementing a successful OEE improvement strategy requires targeted, operational changes. Here are seven prioritized strategies that target specific losses to drive sustainable performance:
1. Make losses visible in real time
You can’t improve what you log on paper hours after a shift has ended. Relying on manual end-of-shift transcription guarantees your data is historical rather than actionable. Real-time data capture is the fundamental precondition for all OEE optimization.
2. Run root cause analysis on the top loss
Stop treating symptoms. If a machine repeatedly stops due to a dirty sensor, cleaning the sensor is a temporary fix. Use automated audit trails to execute a precise root cause analysis (RCA), tracing the failure back to its systemic source—such as an imbalanced exhaust fan causing premature component wear.
3. Standardise the work and the changeover
Human variance creates performance variance. Digitizing standard work and using Single-Minute Exchange of Die (SMED) methodologies reduces changeover windows dramatically, directly cutting both availability and startup quality losses.
4. Tighten preventive maintenance against real failure data
Shift your maintenance teams away from generic, calendar-based PM schedules that service machines based on guesswork. Use live run-hours and actual cycle counts to build a condition-based maintenance program that targets components before they cause an unexpected breakdown.
5. Engage the frontline, not just the dashboard
OEE improvements don't happen in corporate conference rooms; they happen at the machine. Equip operators with mobile tools that show live targets versus actual metrics. Providing immediate visibility motivates frontline teams to identify and close performance gaps before their shift ends.
6. Close the loop from signal to resolution
Don't leave problem resolution to chance. The moment a machine experiences a minor stop or a speed deviation, the system must automatically dispatch the correct, qualified technician with the exact instructions needed. Closing this communication loop minimizes total Mean Time to Repair (MTTR).
7. Make improvement continuous
OEE optimization isn’t a one-off corporate push. It requires a predictable operational cadence. Establish a weekly review process where cross-functional teams analyze production data, execute targeted continuous improvement actions, and immediately verify the results against your OEE baseline.
From measuring OEE to improving it: the manufacturing operations platform
Traditional manufacturing software acts as a passive system of record. It collects historical machine statistics, aggregates data into retrospective reports, and tells you exactly why your plant failed yesterday.
A modern manufacturing operations platform transforms this model by acting as a live system of action. When an industrial asset experiences a speed loss or a quality anomaly, the platform doesn’t just record the event. It uses smart dispatch logic and execution intelligence to route an automated alert to the nearest technician, serves up an interactive digital SOP, and logs the entire resolution process seamlessly.
By unifying your maintenance tracking, production metrics, and frontline workflows into a single cloud-native architecture, you eliminate the integration layers where data gets delayed or lost.
Global manufacturers leverage L2L’s connected approach to quickly realize substantial financial gains. For example, implementations of this unified methodology allowed JELD-WEN to boost overall performance by 53% while helping Oetiker capture an immediate 11% OEE increase across its facilities.
How to set realistic OEE targets
When launching an optimization initiative, it’s critical to avoid chasing unrealistic vanity numbers. While a perfect 100% score is mathematically possible, it's an operational impossibility over a sustained period.
True world-class OEE across discrete manufacturing sectors is generally recognized at 85%. However, top-quartile performance varies significantly by industry:
- Typical Plant: ~60%
- Top-Quartile Target: ~78% - 92%
- World-Class Standard: ~85%
Instead of mandating an arbitrary facility-wide target, baseline your individual production lines first. Identify the single largest loss category on your bottleneck asset, and target a realistic three-to-five point gain in that specific column. Small, data-justified wins on your constraint line deliver far greater bottom-line profitability than a superficial chase for a high vanity number.
Frequently asked questions about improving OEE
What is a good OEE score?
While an 85% score is globally recognized as the world-class standard, a “good” OEE score is entirely relative to your specific facility's starting baseline. For most unoptimized manufacturing environments, moving a line from a stable 60% baseline to a predictable 75% represents a highly successful, high-ROI optimization initiative.
How quickly can OEE be improved?
Facilities can capture immediate "quick wins" within a few weeks by making performance losses visible in real time and automating technician dispatches on their constraint line. However, securing sustained, multi-point OEE gains across an entire enterprise footprint requires establishing a continuous, data-driven operational cadence over several months.
Do I need software to improve OEE?
While you can initiate basic OEE tracking using manual stopwatches and paper log sheets, manual collection creates a severe data lag that naturally caps your improvement rate. Utilizing a modern manufacturing operations platform removes this latency, eliminating manual paperwork errors and providing your frontline with the live insights necessary to drive sustainable performance.
Ready to unlock your plant’s hidden capacity?
Stop watching static metric dashboards and start driving live, automated action on your shop floor. Connect with one of our manufacturing experts to see how separating your operational signals from administrative noise breaks through production ceilings.


.svg)
