



.svg)
 Shop floor execution
 Maintenance
 Production
 Skills
.png?width=60&height=60&name=chart-line-up%20(1).png) Manufacturing Intelligence
Manufacturing Intelligence
 Automotive
 Building materials
 Packaging
 CMMS/EAM
 MES
MES
 Connected Worker
 Manufacturing Intelligence
 Case studies
 Blog
Blog
 Ebooks & Guides
 Webinars
 Events
.svg) OEE Calculator
OEE Calculator
 Downtime Cost Calculator
 About Us
 Partners
 Newsroom
 Support
 Careers
 Trust center


.svg)


Overall Equipment Effectiveness (OEE) is a foundational manufacturing metric that evaluates how effectively equipment is utilized during planned production time. It measures the percentage of scheduled manufacturing time that is truly productive, providing plant leadership with a clear picture of operational efficiency.
Understanding OEE requires evaluating three distinct dimensions of plant performance: Availability, Performance speed, and product Quality (APQ). By combining these three factors into a single percentage, manufacturers can identify operational losses, uncover hidden capacity, and establish benchmarks for continuous improvement on the factory floor.
So what does OEE stand for?
OEE stands for Overall Equipment Effectiveness, a measure of how much planned production time is truly productive.
What is OEE?
In physical terms, OEE quantifies the gap between the theoretical potential of an asset and its actual output during a shift.
An OEE score of 100% represents flawless production, where the machine:
- Produces only good parts with zero scrap (100% quality)
- Operates at maximum theoretical speed (100% performance)
- Experiences no unscheduled stops or setup delays (100% availability)
While 100% OEE remains an ideal benchmark rather than a realistic daily expectation, tracking the metric reveals where production capacity disappears. Most discrete manufacturing plants operate around 60% OEE. This means that four out of every ten scheduled production hours are lost to equipment breakdowns, slow line speeds, changeover delays, or product defects. Measuring OEE allows manufacturers to categorize these losses systematically rather than relying on guesswork.

The three factors: Availability, Performance, and Quality
Calculating OEE requires evaluating three separate components of equipment utilization. Each factor measures a specific category of operational loss, allowing maintenance and production teams to pinpoint the exact root cause of lost output.
Availability
The share of planned production time the equipment is actually running; lost to breakdowns and changeovers.
Performance
How fast a piece of equipment runs versus the ideal cycle time; lost to minor stops and reduced speed.
Quality
The share of good output; lost to scrap, rework, and startup rejects.
The OEE formula
The standard mathematical formula for calculating OEE combines all three operational factors into a single percentage score:
OEE = Availability × Performance × Quality
To calculate each factor, operations teams use specific time and production metrics:
- Availability: Actual Run Time divided by Planned Production Time. Run Time equals Planned Production Time minus unscheduled stop time and planned changeovers.
- Performance: (Ideal Cycle Time × Total Parts Produced) divided by Run Time. Alternatively, actual operating speed divided by design speed.
- Quality: Good Parts Produced divided by Total Parts Produced. Good parts represent total units minus scrap, defectives, and items requiring rework.
Consider a concrete production line example:
If a packaging line achieves 90% Availability due to a changeover, runs at 95% Performance speed due to minor conveyor jams, and maintains a 98% Quality rate after throwing out initial warm-up units, the calculation is:
0.90 (Availability) × 0.95 (Performance) × 0.98 (Quality) = 0.8379 (83.8% OEE)
In this scenario, despite achieving over 90% in every individual factor, compounding losses reduce total line effectiveness to 83.8%. For a comprehensive breakdown of edge cases, shifts, and mathematical variations, review the full OEE Calculation Guide.
What is a good OEE score?
Determining a good OEE score depends heavily on industry standards, equipment complexity, and product mix. However, general benchmarks help manufacturing leaders evaluate plant health:
- 100% OEE: Theoretical perfection that is rarely sustained in real-world production environments.
- 85% OEE: Widely recognized as world-class performance for discrete manufacturing operations. Achieving 85% typically requires individual factors near 90% Availability, 95% Performance, and 99% Quality.
- 60% OEE: Typical for average discrete manufacturing facilities. A 60% score indicates substantial room for improvement, particularly in equipment reliability and changeover efficiency.
- 40% OEE or below: Indicates a highly reactive operation suffering from chronic equipment failures, frequent minor stops, or significant scrap rates.
So, why shouldn't plant managers treat 85% as a universal target for every asset?
Because high-mix, low-volume facilities with frequent product changeovers naturally experience lower Availability scores than continuous process lines. For plant leadership, tracking the trend against an organization's own baseline matters far more than hitting an arbitrary external target. Sustained growth above an established baseline indicates that operational changes are successfully reducing waste.
OEE and the Six Big Losses
Total Productive Maintenance (TPM) methodologies group shop-floor waste into the Six Big Losses. OEE directly maps these six losses to its three core components, making it easier for engineering teams to apply targeted corrective actions:
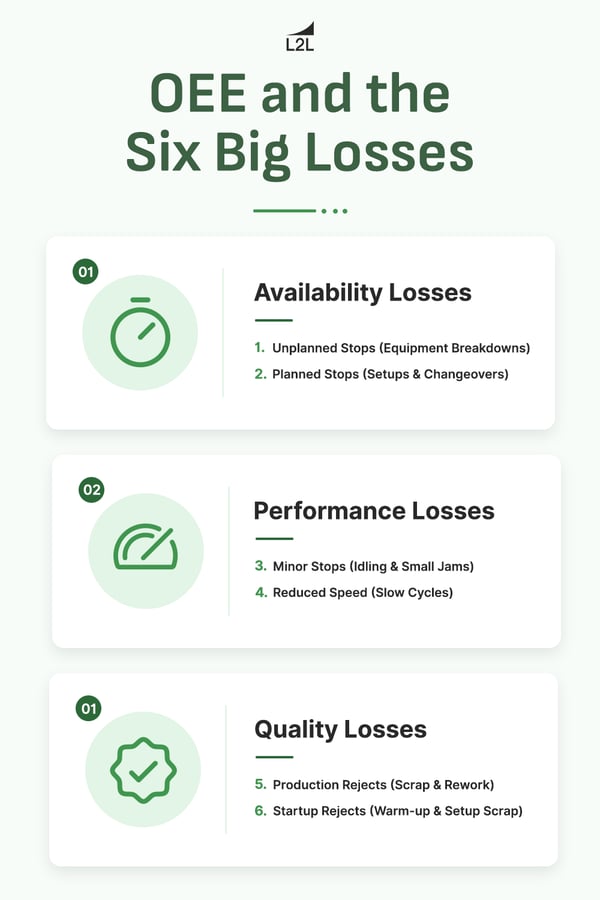
Addressing these six loss categories systematically converts lost machine time into billable production capacity. To learn more about tactical frameworks for attacking each loss category, read our guide on.
Why OEE matters (and where it falls short)
Why do global manufacturers rely so heavily on OEE?
Because it collapses three complex operational variables into a single, unambiguous performance signal, OEE allows operations executives to compare different production lines, evaluate shift-to-shift consistency, and prioritize capital investments based on objective loss data.
However, OEE has limitations when applied incorrectly. Why can focusing blindly on OEE backfire?
- Vanity metrics over actual output: If plant leaders use OEE strictly as a punitive tool, supervisors might reclassify unscheduled breakdown time as scheduled maintenance or slow down ideal cycle time parameters. This inflates the OEE score on paper without producing a single additional sellable unit.
- Ignoring total capacity: OEE only measures performance during planned production time. If a machine sits idle because no orders are scheduled, OEE remains unaffected, even though asset utilization is low.
- Isolating machines from flow: Maximizing OEE on a non-constrained asset can build excess work-in-progress (WIP) inventory, crowding the shop floor without improving total facility throughput.
OEE functions best as a diagnostic compass rather than a standalone operational target. It shows teams where time and material are being lost, guiding continuous improvement efforts toward true bottlenecks.
Real-world examples of OEE in action
Examining real-world manufacturing environments shows how tracking OEE shifts plant culture from reactive troubleshooting to structured problem-solving.
Real-world outcomes with modern operations platforms
Oetiker: The global industrial connecting supplier faced performance variations across its ten international assembly sites due to isolated data sets and inconsistent shift handovers. By implementing standardized production monitoring tools and digital shift boards, Oetiker achieved an 11% OEE increase in six months at its pilot plant and reduced Mean Time to Repair (MTTR) by 23% across its global network.BorgWarner: The automotive component manufacturer needed to eliminate manual data collection that delayed daily operational insights. Plant managers previously spent hours compiling production spreadsheets. Implementing automated real-time OEE tracking reduced data analysis time from a full week to 20 minutes, drove a 10% increase in OEE in six months, and helped operational availability reach 90% in key bottleneck areas.
ADAC Automotive: Facing tight just-in-time delivery schedules, the Tier-1 automotive supplier deployed digital tracking across 200 assembly lines in four facilities. Connecting maintenance dispatch directly with real-time OEE metrics produced a 15% increase in plant OEE, a 62% reduction in major downtime events, and a 367% improvement in on-time preventive maintenance compliance.
How to measure OEE in real time
Manual OEE tracking is ineffective in modern manufacturing because paper log sheets and end-of-shift spreadsheets capture data hours or days after disruptions occur. When operators write down downtime reasons on clipboards, micro-stops under five minutes are rarely documented, and cycle time drift remains completely invisible. By the time a supervisor reviews paper shift logs, the opportunity to recover lost throughput during that shift has passed.
Measuring OEE in real time solves this delay.
Connected systems capture machine run signals directly from sensors or Programmable Logic Controllers (PLCs), recording the exact second an asset stops or slows down.
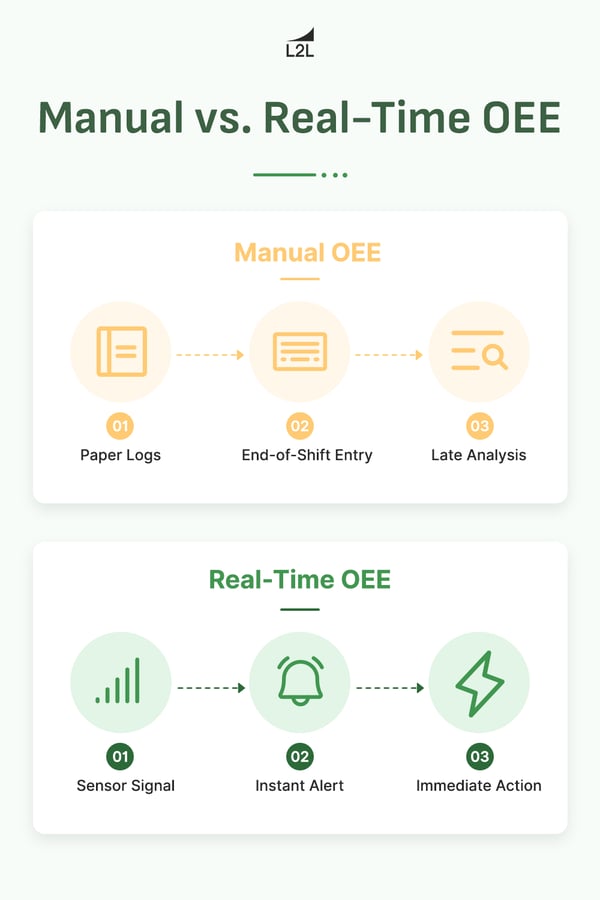
When an automated system combines machine signals with frontline inputs, it turns raw metrics into guided execution. Linking real-time OEE tracking within modern MES software and digital CMMS platforms ensures that when line speed drops or a stoppage occurs, automated dispatches immediately notify nearby maintenance technicians or quality inspectors. Real-time visibility converts passive historical reporting into live shop-floor execution.
Frequently asked questions about OEE
What does OEE stand for?
OEE stands for Overall Equipment Effectiveness, a standard manufacturing metric that measures the percentage of planned production time that is truly productive. It evaluates equipment availability, operating speed, and output quality to provide a comprehensive measure of asset utilization.
How is OEE calculated?
OEE is calculated by multiplying Availability, Performance, and Quality together as percentages. Availability equals actual run time divided by planned production time. Performance equals actual production speed divided by ideal cycle speed. Quality equals good units produced divided by total units produced.
What is a good OEE score?
An OEE score of 85% is widely recognized as world-class performance for discrete manufacturing operations. Most typical manufacturing facilities operate near 60% OEE. However, a good score is relative to an organization's historical baseline and long-term improvement trends.
What are the six big losses in OEE?
The six big losses include equipment breakdowns and setup adjustments for Availability; minor stoppages and reduced operating speed for Performance; and process defects and startup rejects for Quality. Categorizing downtime against these losses helps teams target root causes effectively.
Can OEE be over 100%?
No, an OEE score cannot exceed 100%. An OEE calculation resulting in a score over 100% indicates that the ideal cycle time baseline was set incorrectly or that nameplate equipment parameters do not reflect true operational standards.