


 Shop floor execution
 Maintenance
 Production
 Skills
.svg) Execution AI
Execution AI
 Quality
 Training & Skills
 Building materials
 Packaging
 CMMS/EAM
 MES
MES
 Connected Worker
 Manufacturing Intelligence
 Case studies
 Blog
Blog
 Ebooks & Guides
 Webinars
 Events
 Downtime Cost Calculator
 Digital Maturity Assessment
 About Us
 Partners
 Newsroom
 Support
 Careers
 Trust center


Overall Equipment Effectiveness (OEE) has often been misused and misunderstood at the plant level. This metric is sometimes used as a "stick" rather than as an indicator of where help is needed. The result is that this metric is often hidden from the very people who need to be aware of it the most. If the people on the plant floor aren't given the OEE data, they're powerless to change or improve OEE. Being able to view these KPIs in real time via an OEE dashboard gives you powerful data to continually optimize plant performance.
OEE is a complex metric that uses many calculations and numbers to arrive at a single result that many people believe is the tell-all about the site’s performance. For these and many other reasons, OEE is often not used or fully understood on the execution side of the business: the plant floor. In this article, we’ll cover the elements and calculations of OEE and how you can better use it to suit your plant.
Elements of OEE
-
Availability and Performance expose inefficiencies caused by downtime, but they each take a different approach. Both use Run Time, which is how much time a line actually runs, but availability uses Planned Production Time, and Performance uses Ideal Run Time (which is the product of Ideal Cycle Time and Total Count).
-
Operation Availability uses planned production minutes minus downtime. I remember having spirited discussions with my colleagues in Europe on what to include in each of these categories. Do you 'count' PM time or not? Is that planned or is it downtime where the line could run? Do you factor changeover times into the equation? What about line meetings and company safety events? Whatever your philosophy is planned and non-planned production, you need to make a standard for all to follow. Also, your Lean Execution System (LES) should help facilitate this important activity.
-
Quality reveals inefficiencies caused by bad parts. It's broken down between good parts, rework, and scrap. Clearly define what constitutes defects and how to process and disposition these instances. Capture scrap as a loss.
-
Performance is the last piece of the OEE equation. Establish standard cycle times for the products and line equipment. Sometimes, the debate here is whether to set cycle time based on the capacity the equipment was designed to run at. This means running continually with zero machine-related defects and no unplanned downtime. You can also set your standard cycle times based on the best demonstrated cycle time performance the line ever achieved. Is that now your baseline, and are you continually lowering the water in the river to expose more rocks as you improve?
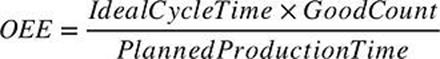
OEE Calculation Revealed
In order to illustrate the nuances of OEE, I’m going to rewrite the OEE calculation using the raw components of the contributing metrics.

Here’s where it gets interesting. Run Time and Total Count are canceled out since they are both in the numerator and the denominator.

Now we can rewrite the OEE calculation like this:
Just to validate the math, here are a few examples of OEE, calculated both the long way and the short way:
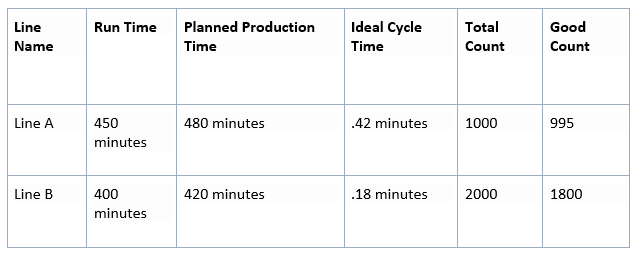
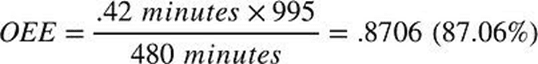
Line A OEE long calculation:

Line A OEE short calculation:
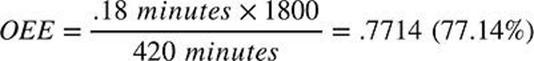
Line B OEE long calculation:

Line B OEE short calculation:
As you can see in these two examples, the end result is exactly the same no matter which formula you use. I encourage you to test these formulas using metrics from your plant.
OEE is actually a ratio of Ideal Production Time to Planned Production Minutes. Ideal Production Time is how much time it would take to produce parts in a perfect world with no downtime, no defects, and with each line producing parts as fast as it possibly can. The perfect world doesn’t exist, so Planned Production Minutes account for the inevitable downtime and defects.
Does this mean that your OEE calculation is useless? Not at all. It can be used as an indicator, or as an invitation for a conversation. OEE by itself can’t tell the entire story. If your plant is using OEE exclusively, consider including Availability, Performance, and Quality in your OEE report as well. L2L’s OEE report includes all four metrics on a common trend chart.
Who uses the OEE Metric, and How?
OEE data is often used in support groups like the following:
Engineering and Maintenance Departments: Both Engineering and Maintenance use OEE to see which pieces of equipment are running inefficiently. They specifically look at the amounts of unproductive time per machine, or line, or area for example. They can then use Pareto analysis to point to where the real problems are. Maybe the equipment is down due to repairs, or maybe the machine is not running because there are no parts feeding into it. OEE can provide a broad overview to highlight underperformance. Maintenance and Engineering can now dig into the data. Your CMMS should make this data visible to everyone — on and off the plant floor. With data immediately accessible, Engineering and Maintenance now have more detailed information and can better understand the underlying issues to make good decisions on how to address the problems.
Finance: Finance folks love to use OEE! It's a handy metric to measure the ROI on capital expenditures. They review the OEE to determine if they get the return they need to justify the expenditure, or as a means of analysis to gauge when to buy more equipment. They need to keep the economic engine turning.
Operations: As a plant metric used to help gauge where performance improvements are needed, operations teams focus on the metrics that make up OEE (Performance, Quality, Availability). Focusing on these metrics lets them take action on specific needs, such as increasing uptime, improving scrap numbers, and aligning with theoretical efficiency.
Your OEE Dashboard Can Be a Barometer of Success
It seems perfectly logical that divisional, regional, and/or corporate-level operations managers should use OEE as an indicator of the overall health of their business units. However, OEE alone won't tell you the whole story.
OEE can be a helpful barometer to determine where help and additional resources are needed, such as which plants in their business family may be struggling for one reason or another. In this manner, OEE can be viewed as a walking stick used to navigate the continuous improvement path. I believe you should break OEE down and track the three main KPIs that make up OEE, like downtime (OA), production efficiency (PEFF), and scrap. As you build KPIs around these metrics, you'll make more progress because they're not just measurable, but actionable — at all levels on the plant floor. Your people will understand what's impacting losses of performance with these metrics.
If you focus on OEE as your most important indicator, you could be storing a bunch of parts in your warehouse in hopes that demand will increase, and when it does, you'll be ready. This is because OEE emphasizes building as fast as possible (theoretical throughput) instead of setting run rates to reflect the demand or customer orders.
Where OEE Gets Manipulated
OEE is frequently manipulated. Whether intentionally or unintentionally, it still blurs your ability to understand if you’re making real progress. How does manipulation happen? There are a few reasons:
It uses theoretical throughput, so which cycle time do you use?
-
Designed speed on prints? Probably not because that will give you a low OEE.
-
Demonstrated cycle time? Better, because it's likely the successful day's run you measured had the inefficiencies in it (like downtime).
-
Do you use the same cycle time for all products or actual time studies for each product?
How about planned production time?
-
Do you count planned production minutes? Or changeover minutes? Most don’t because it's too much work to figure out and track.
When comparing lines or areas, or even plant to plant, you need to make it as close to "apples to apples" as possible if you choose to use this measurable.
The Value of an OEE Dashboard
Operations leaders need a good OEE dashboard — one that is easy to pull up with data displayed so it's visible to everyone. When OEE is used as an "overall" guide, leaders can ask better questions. As a tool, it aids upper management to make informed decisions faster.
Leaders need to be able to see all of the plants on one screen. They also need the ability to see a breakdown of the overall score. A lump sum is hard to digest and harder to make sense of, let alone explain to others. Seeing OEE broken down into the main categories of Availability, Quality, and Performance is far more helpful in telling the full story. An OEE dashboard needs the ability to display data at the site level and drill into the area and line level to quickly see the performance indicators. In doing so, leaders can understand what questions to ask and determine the help needed to course correct. A pareto analysis of the major three indicators of OEE can tell you where to focus your efforts and on what issues.
For best results, hold your teams accountable for the following KPIs:
-
Actual parts produced vs. scheduled demand for production and engineering
-
Equipment downtime for maintenance
-
Material shortages for warehouse runners as well as procurement
-
Scrap numbers for quality to focus on
These are easy to track and are generally better indicators of performance. The next step is to get this data in real time. That way, your teams will make the right judgment calls and even know what to fix to course correct throughout the day.
A good OEE dashboard that you can pull up on your phone is worth its weight in gold. However, you might get some pushback from the plants. We'll explore why this happens next.
DOs and DON'Ts of Using an OEE Dashboard
Whatever you decide to use as the standard when you set up OEE in your LES system, make sure you base your decisions on data and not emotions. Use your OEE dashboard to indicate where you need to go in the plant and what questions you need to ask to ensure a comprehensive understanding of the problems.
-
Don’t chase after the shiny penny, just trying to hit what some call "world-class," or above 85% OEE. Numbers aren't everything.
-
Don’t use OEE as a stick to be wielded, or you'll de-motivate your people.
-
Do use OEE to point you in the right direction.
-
Do get a good LES, like L2L, that supports your corporate manufacturing vision.
-
Do create standards for each plant to follow in your LES.
-
Do use an OEE dashboard to see where to focus on providing help. The key word here is "help."
At the very least, please be aware of what an OEE calculation can actually tell you. On the flip side, be aware of what OEE can’t tell you. OEE has never swung a hammer and most definitely can’t turn a wrench.
OEE doesn’t lie, but it can’t tell the whole truth. No one metric alone tells the whole truth. There isn’t a single report that can match the data you can gather from your most valuable asset: your coworkers. So, the next time your OEE takes a dip, take a walk. Have a quick chat with the line operator. It’s the only way to learn what OEE has been hiding from you.
For these reasons, I recommend a corporate-wide LES like L2L that can help with collecting the data needed to understand current conditions and aid in decision-making based on data. This data must come from a system used at each plant, not plant-specific Excel charts uploaded weekly into a shared folder.
If you found this post interesting, then you'll also enjoy this video: Going Deeper with OEE.


