[Video Transcript] - When you're looking at data, are you looking at what you think is the problem, or are you looking at what the problem really is? Because you can get distracted and you are not looking at the right things. Let me tell you about a little trip that I recently had that kind of illustrates this point.
So for Christmas this year I bought my wife tickets to a show in Las Vegas. And my grand scheme was that we were going to meet at the Salt Lake airport, I was going to fly in from a business trip and we were going to drive in Las Vegas and go to the show on Friday night. Well, obviously, plans can go South when you are dealing with airlines. I got down to Phoenix, I was getting ready to come back up to Salt Lake City, and the flight was delayed. So what I did was I rented a car, in Phoenix, and drove from Phoenix to Las Vegas, the scenery was great. It was beautiful. I've never been on that road from Phoenix to Las Vegas, I was checking out the scenery and I was looking at the mountains and the desert views and it was beautiful as you come up to the Nevada line.
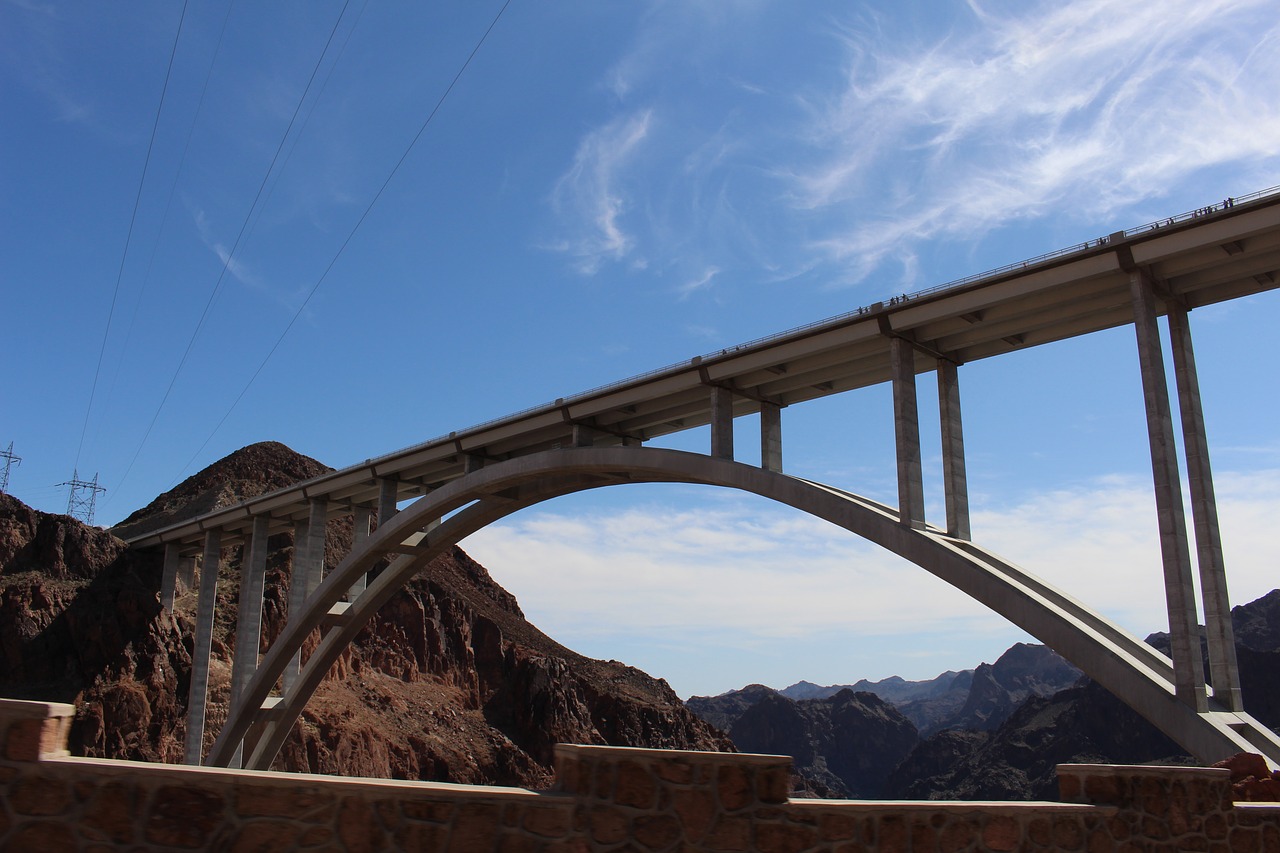
At one point in time I kind of caught off to the driver's side, a glimpse of what I think now is the Colorado River. And so my vision and my attention was drawn over to that side of the road. I started seeing signs for Lake Mead, and for the Hoover Dam. And the bridge said, “bridge walkway”, never saw what the bridge was called and didn't really pay much attention to it. The next day we were going to go to the NASCAR race there in Vegas, but it was actually raining so I knew that probably wasn't going to be a good thing to do and so we kind of canceled our plans to go to the race the next day. So instead we decided to drive back out to see the Hoover Dam, and go see Lake Mead and drive around the countryside there.
As we drove down into the Hoover Dam Visitor Center, we came around a corner. And as soon as we came around a corner I immediately realized that the bridge from yesterday everybody was talking about was this incredible piece of construction, an incredible engineering feat that had been built. It was a brand new bridge called the Michael Callahan Pat Tillman Memorial Bridge and it was spanning the gorge across the Colorado River from Arizona to Nevada. I had passed right over and had no idea. Well let me tell you what an incredible piece of engineering this thing is, it was just it was beautiful. Just, spectacular. We had a great time. We looked at the bridge and walked out on the bridge and looked out over the Hoover Dam from the bridge it's way up there, and there were a few people that went up there, if you're afraid of heights it's definitely not the place you want to go to but we had a great time up there.
Anyways as I'm kind of walking back and, and we're taking our drive I got thinking, you know, in manufacturing we do this a lot where we get distracted by the shiny penny or we get distracted by the problem of the day, or we get distracted by issues that aren't really the root cause of our issues. We get distracted by things such as not enough people for the day or I'm not sure of what product we're running that day. But, but do we ever really dive deep down into the data, and try to find the problem? Do we really ever know what's underneath the bridge, if you will. Do we know what is holding up our entire process? And do we use the data to drill down underneath and see the structure and see the underpinnings of what's holding up our whole process inside of our manufacturing process? No we don't. We spent a lot of time looking at the problems, but we don't spend a lot of time actually trying to look down in and fix things and we need one great metric to do that is OEE.
If you've used OEE before, you'll know that OEE is basically made up of three factors: availability X performance X quality. And so it lends itself to this fantastic ability to automatically use Pareto Analysis, because we know that if you want a raise of the overall factor, if you want to raise the overall OEE number all you really need to do is concentrate and look deeper into the one factor that is the lowest of the three. And when you raise that up another one will be the lowest and then you concentrate on that one. So what L2L does here really well is, we are able to take that data in real time.
We know in real time what machines are down we know in real time what problems the operators are fixing. And so we're able to display that information out on the shop floor for everybody to see.Then you have the ability to drill down deeper, our OEE dashboard allows you to drill down into those three factors and see where your problems are within the system all in real time.
So don't get distracted by the problem of the day. Don't get distracted by the beauty off to the left side of your truck or don't get distracted by not having enough focus for the day that's going to be over tomorrow or don't get distracted by the one small downtime that you have that never happens. Don't get distracted by that stuff. Take your data. Look at it, try to find what's going on, drill down into it. Look at the understructure of what's happening. Don't pass over that bridge and not understand what's holding you up. Don't pass over a production run and not understand what's keeping you from being a top performer as far as a company goes.
For more perspective on simplifying OEE and how to use it, read: Is OEE The Right Metric For Your Plant.

 Daan Assen